Category Archives: Surface co-display of cellulases with synergy in Pichia pastoris

Surface co-display of cellulases with synergy in Pichia pastoris (Part VII)

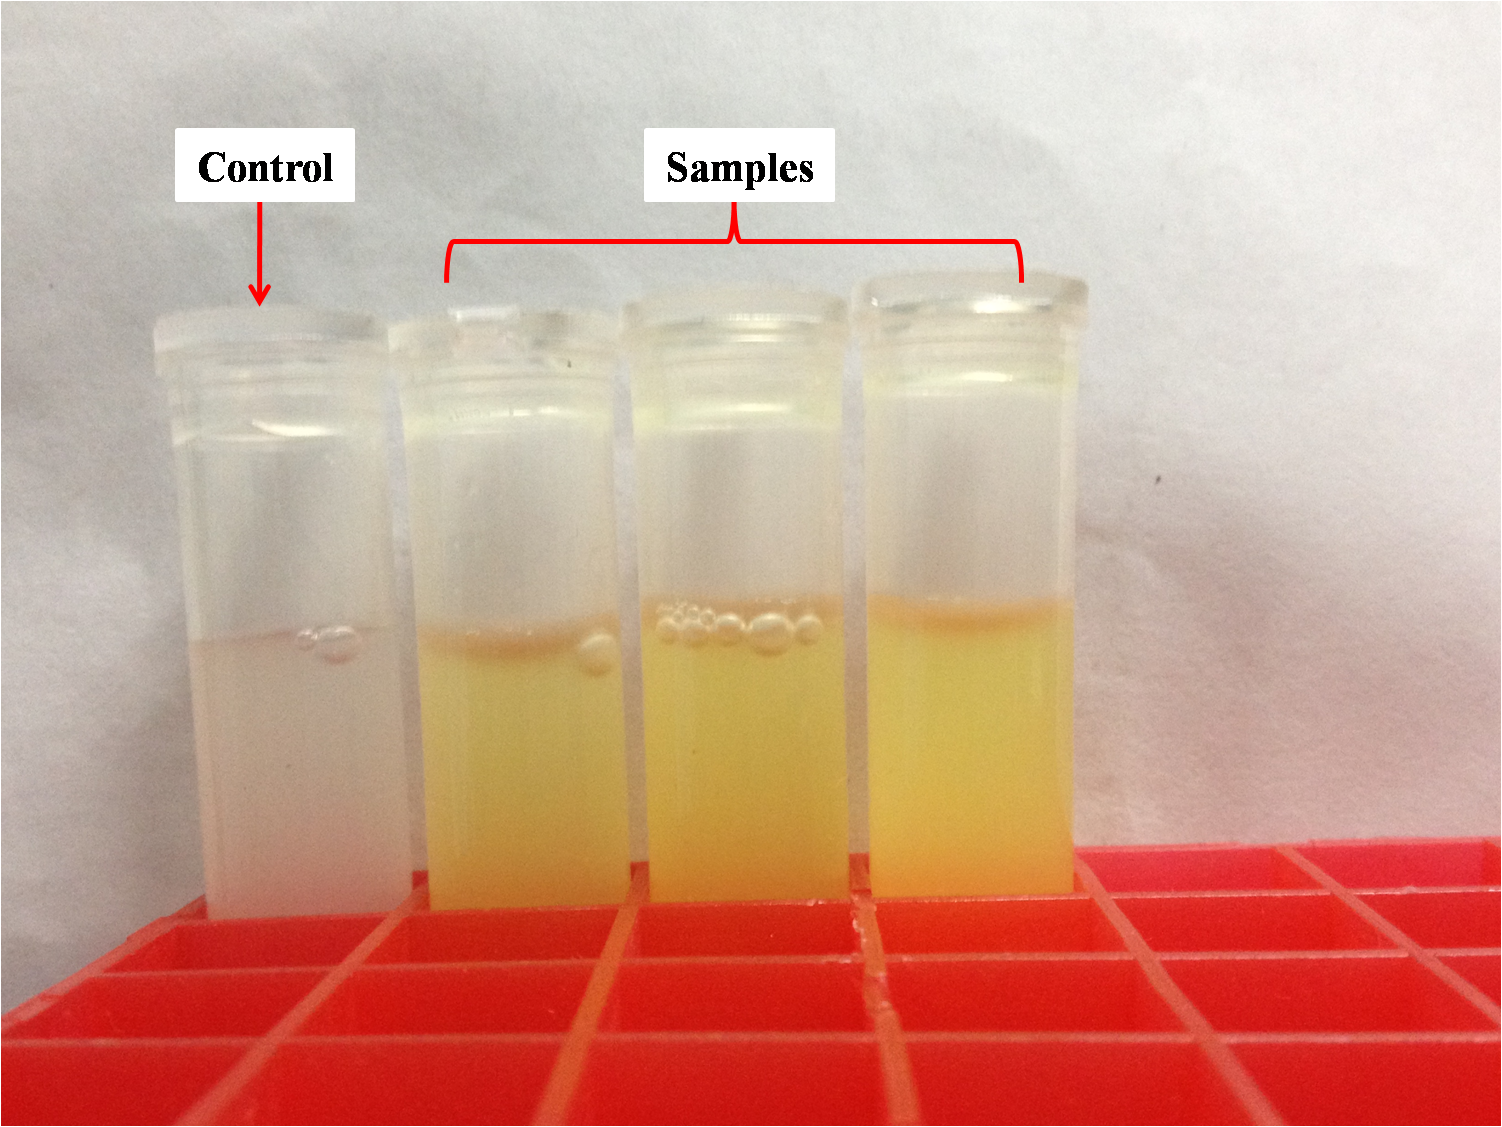
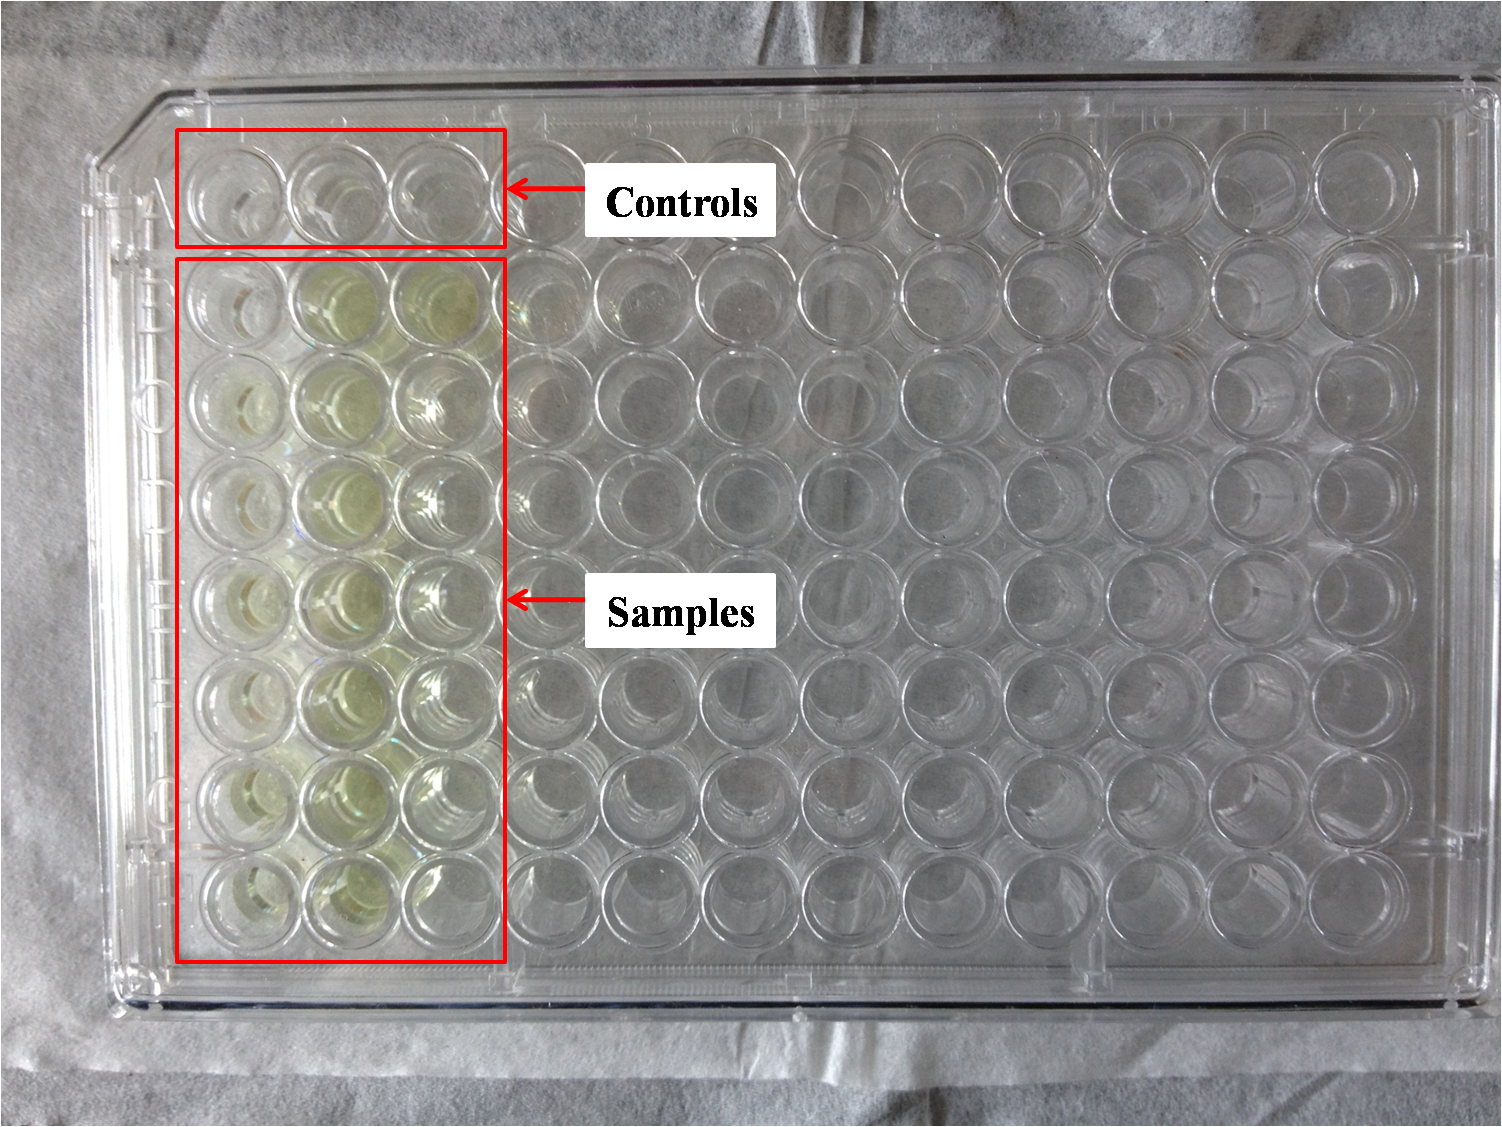
It is exciting to obtain strains with high enzyme activity, but do cellulases truly locate on the surface of our Pichia pastoris? We need further experiments for verification.

Step 11. Immunofluorescence assay

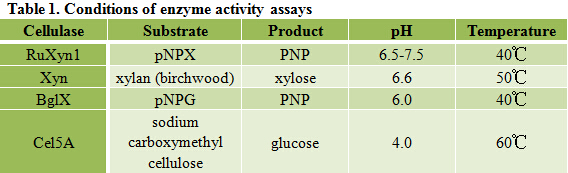
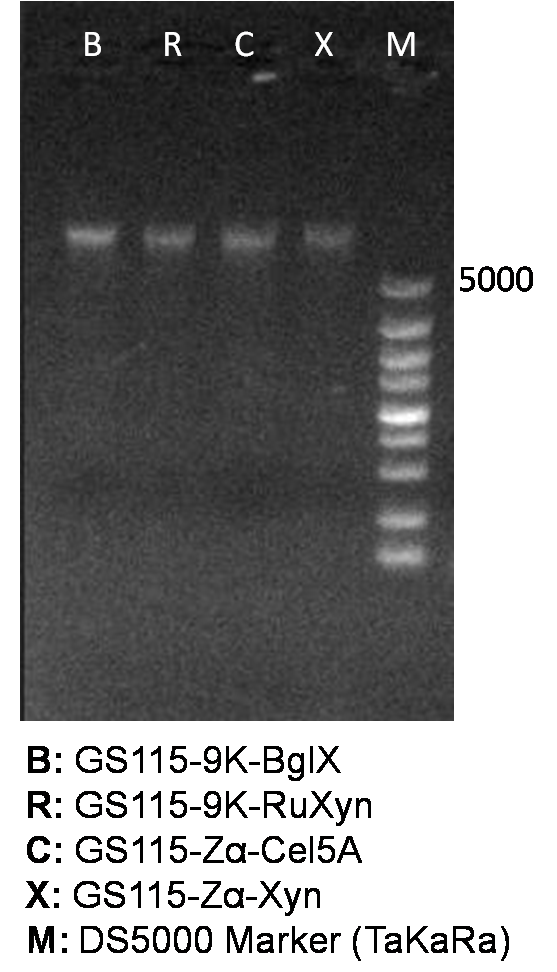
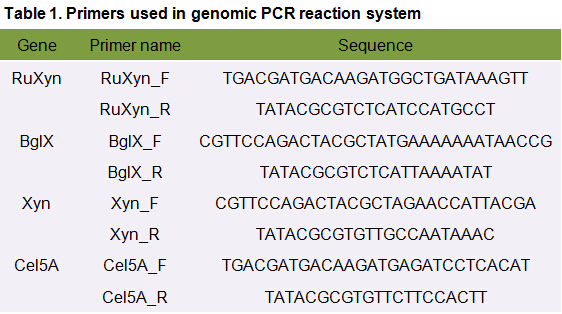
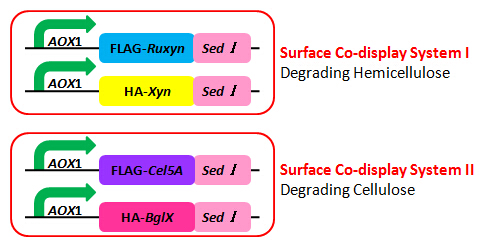
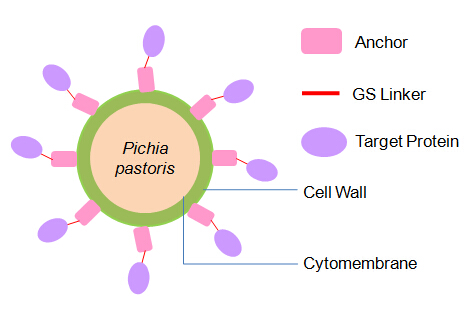
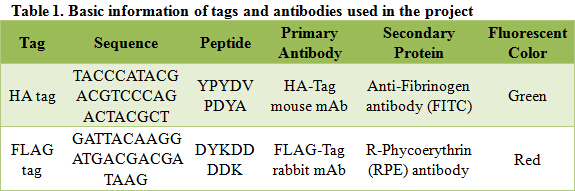
As described in my previous post (Surface co-display of cellulases with synergy in Pichia pastoris (Part II)), our cellulases are expressed with a tag (Table 1), which can bind specifically to their primary and secondary antibodies, thus be detected by immunofluorescence assay.

Basic information of tags and antibodies used in the project

Protocol:

Take 2mL enzyme solution and collect cells by centrifugation at 4℃, 12000rpm for 1 minute. Wash cells twice with ice cold PBS buffer (pH=7.4). Resuspend the cells in 250μL 1mg/mL BSA (dissolved in PBS buffer (pH=7.4)), and add 2μL (approximately 1μg) primary antibody into the mixture. React cells with primary antibody for 2 hours on ice or overnight at 4℃. After reaction, centrifuge and remove the liquid, then wash cells twice with ice cold PBS buffer (pH=7.4). Resuspend the cells in 250μL 1mg/mL BSA (dissolved in PBS buffer (pH=7.4)), and add 2μL (approximately 1μg) secondary antibody into the mixture. React cells with secondary antibody in dark place for 2 hours on ice (remember to mix the reaction mixture every 20 minutes). After reaction, centrifuge and remove the liquid, then wash cells twice with ice cold PBS buffer (pH=7.4). By now, secondary antibody has bound to our cellulase in ideal condition. To view cells under fluorescence microscope, resuspend cells in 500μL ice cold PBS buffer (pH=7.4), add 5μL resuspended cells to a clean and dry slide, affix a piece of coverslip to the slide and allow the coverslip to dry in the dark before viewing.

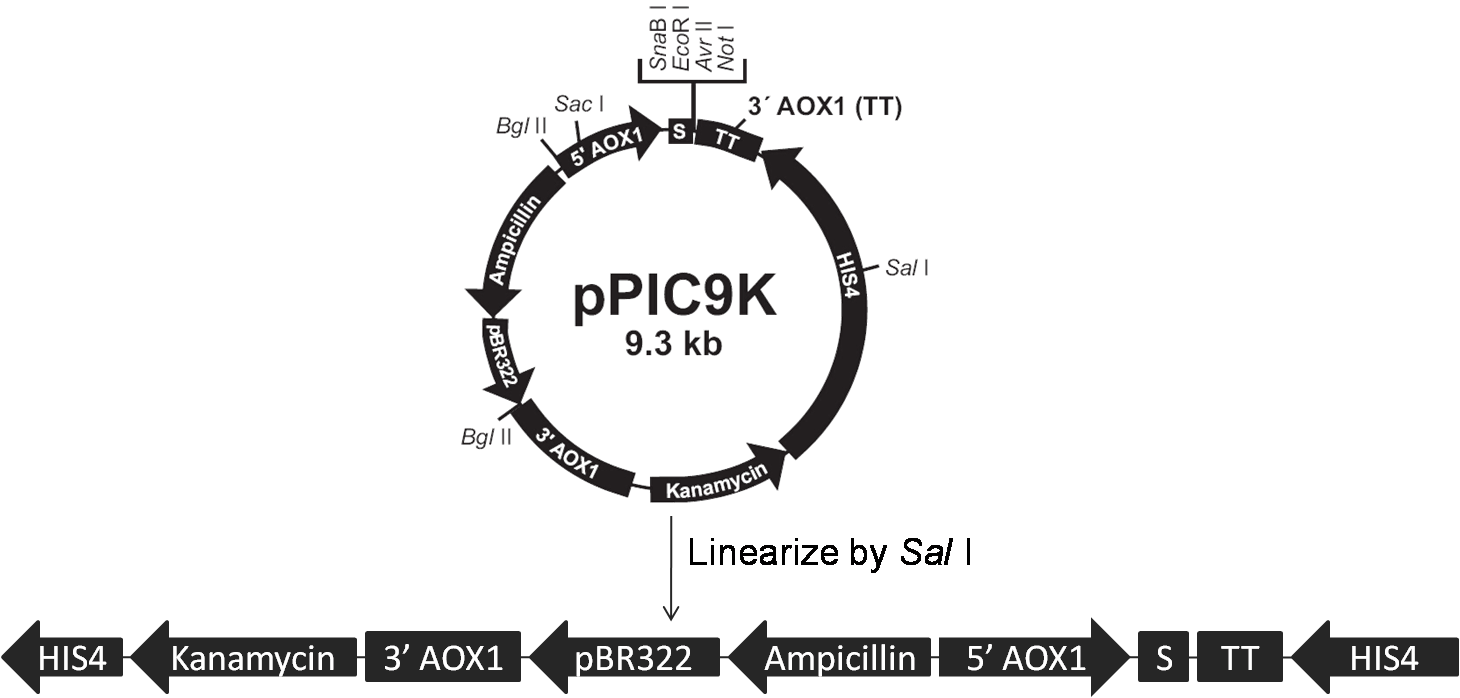
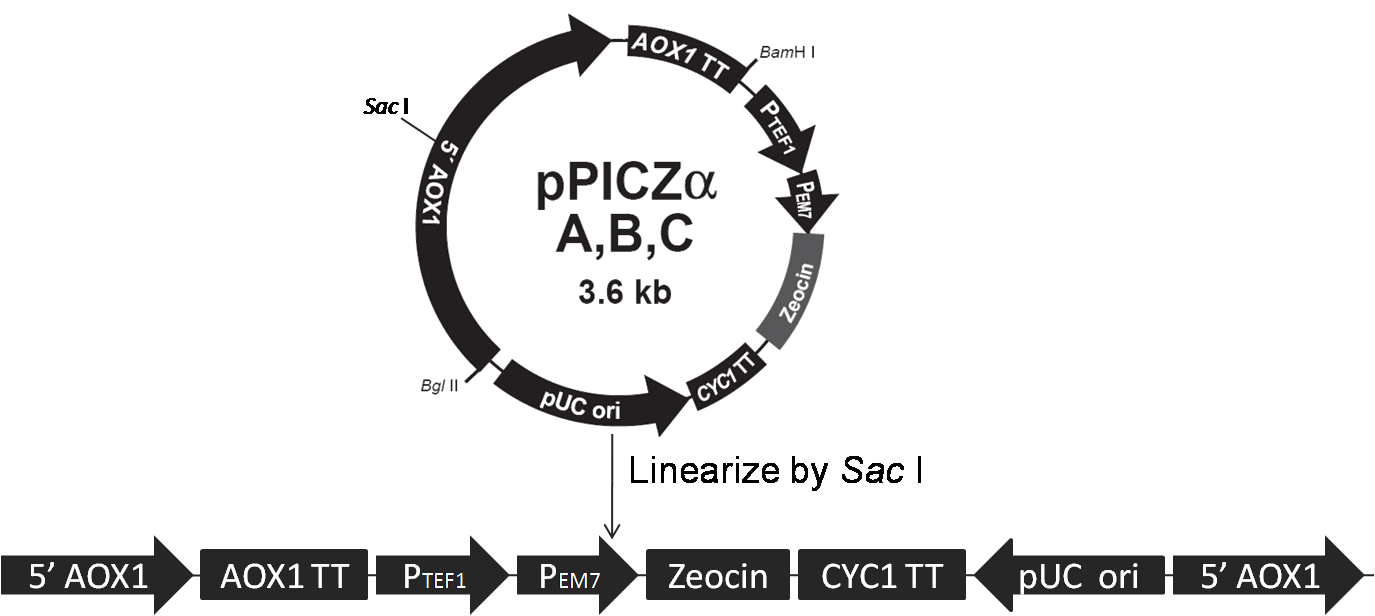
Data are meaningless without a proper control. When the concentration of the antibody is too high, non-specific binding can still exist even after several times of washing; the secondary antibody can even bind directly to cells with no cellulases on their surfaces! Pichia pastoris strains carrying the backbone of vectors (pPIC9K or pPICZα) are used as negative control; their treating processes are exactly the same as our samples.

Besides negative controls, we also need pictures in bright field for both samples and controls; they are used to confirm that 1) what you are viewing is truly cells; 2) the only reason you see nothing in control groups is that no secondary antibody binds to the cells.

Figure 1. Immunofluorescent Assay of pPIC9K-HA-BglX and pPICZα-FLAG-Cel5A

Figure 1. Immunofluorescent Assay of pPIC9K-HA-BglX and pPICZα-FLAG-Cel5A

As shown in bright field, in both sample groups (Figure 1- pPIC9K-HA-BglX and Figure 1-pPICZα-FLAG-Cel5A ) and control groups (Figure 1-pPIC9K and Figure 1-pPICZα), there are cells on slides. However, fluorescence can only be seen in sample groups, indicating that our cellulases really locate on the surface of Pichia pastoris.

Step 12. Flow cytometry analysis

Besides knowing the location of our cellulases, we also want to know how many of our Pichia pastoris have cellulases displayed on their surfaces. To acquire this knowledge, we need flow cytometry analysis.

Flow cytometry is a fast and high throughput method that can scan single cells flowing past excitation sources in a liquid medium, and classify cells based on the measurement of fluorescent light emission. In other words, flow cytometry analysis can divide our cells into two groups; one displays cellulases on their surface (with fluorescent light emission), the other does not (without fluorescent light emission).

Figure 2. Flow Cytometry of pPIC9K-HA-BglX and pPIC9K

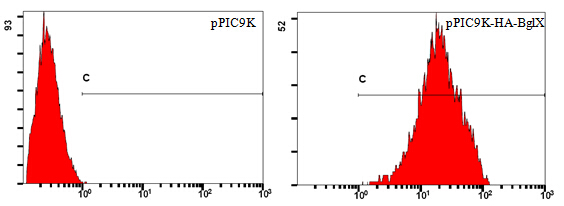
Figure 2. Flow Cytometry Analysis of pPIC9K-HA-BglX and pPIC9K

Take pPIC9K-HA-BglX as an example (Figure 2). Cells carrying the backbone of pPIC9K are used as negative control. Numbers on horizontal axis represent relative fluorescent intensity of single cells, which are proportional to the amount of cellulases displayed on single cells. Vertical axis shows relative quantity of cells.

Lines in both pictures are identical; its left end corresponds to the highest fluorescent intensity of single cells in the control group. Single cells in the sample group, which have higher fluorescent intensity than the highest fluorescent intensity in the control group, are considered truly displaying cellulases on their surfaces. The percentage of cells display cellulases on their surfaces can be read directly using professional software, like FlowJo.

Surface co-display of cellulases with synergy in Pichia pastoris (Part VI)

Step 10. Enzyme activity assay

As cellulase is supposed to display on the surface of Pichia pastoris, we will directly conduct the enzyme activity assay using collected cells.

We take 5mL fermentation liquid from 500mL flask used for continuous fermentation and put it into a 7mL tube. Cells are then collected by centrifugation at 4℃. Supernatant in the tube are discarded, and sediment (cells) is washed by 0.05M NaAc-HAc buffer (pH=5.0) for twice. After washing, cells are resuspended by 0.05M NaAc-HAc buffer (pH=5.0) to OD600=5 for enzyme activity assay.

Different cellulases have different properties, including substrate specificity, optimum pH and temperature, etc, thus require different conditions for enzyme activity assays. Conditions we use for each cellulase in this project are recorded in Table 1.

Conditions of enzyme activity assays

Cellulase activity is assayed by measuring the amount of product (xylose, glucose or PNP) released from corresponding substrate. The amount of product is determined by spectrophotometry. As spectrophotometry has a limited linear range, we need to make standard curves for each substrate before enzyme activity assays; thus, we can prepare samples whose concentration is qualified for reliable measurement. Also, standard curves are necessary for our converting absorbance to specific amount of product.

Xylose Standard Curve

Glucose Standard Curve

PNP Absorbance Curve

 RuXyn1 Activity Assay

The total reaction system of 1mL contains 0.1mL enzyme solution (resuspended cells) and 0.9mL 5mmol/L pNPX (p-nitrophenyl-D-xylopyranoside) (dissolved in 0.05M NaAc-HAc buffer (pH=5.0)). For preheating, the reaction system is incubated at 40℃ for 5 minutes before the addition of enzyme solution. After incubation at 40℃ for 10 minutes, the reaction was terminated by adding 2mL 1mol/L Na2CO3. To reach a proper concentration for measurement, the reaction solution is diluted by adding ddH2O to 15mL. The RuXyn1 activity is determined by measuring the absorbance at 400nm. The background hydrolysis of the substrate is deducted by a reference sample whose content and treating process are exactly the same as the reaction mixture except no enzyme solution is added. One unit (U) of enzyme activity is defined as the amount of enzyme required for releasing 1μmol of PNP per minute.

Xyn Activity Assay

The total reaction system of 1mL contains 0.1mL enzyme solution (resuspended cells) and 0.9mL 1% xylan (birchwood) (dissolved in 0.05M NaAc-HAc buffer (pH=5.0)). The preheating, reaction and incubation processes are the same as RuXyn1 activity assay, except that the temperature is 50℃ for Xyn. After incubation, 3mL DNS is added to the reaction mixture, and the following reaction is carried out in boiling water bath. After 5 minutes of reaction, tubes are taken out from boiling water and cooled in cold water. The Xyn activity is determined by measuring the absorbance at 540nm. The background hydrolysis of the substrate is deducted by a reference sample whose content and treating process are exactly the same as the reaction mixture except no enzyme solution is added. One unit (U) of enzyme activity is defined as the amount of enzyme required for releasing 1mg of xylose per minute.

BglX Activity Assay

As BglX and RuXyn1 have the same reaction product, PNP, their activity assays are also quite similar, except that the substrate for BglX is pNPG (p-nitrophenyl-D-glucoside) (dissolved in 0.05M NaAc-HAc buffer (pH=5.0)). One unit (U) of enzyme activity is also defined as the amount of enzyme required for releasing 1μmol of PNP per minute.

Cel5A Activity Assay

As the reaction product of Cel5A and Xyn are both monosaccharide (glucose and xylose, respectively), their activity assays are also quite similar, except that the substrate for Cel5A is 1% sodium carboxymethyl cellulose (dissolved in 0.05M NaAc-HAc buffer (pH=5.0)), and the optimum temperature is 60℃. One unit (U) of enzyme activity is defined as the amount of enzyme required for releasing 1mg of glucose per minute.

As for measuring absorbance, you can either use microplate reader or spectrophotometer. The processes of sample preparation are similar – use tubes (Figure 1) if you choose spectrophotometer, use 96-well plates (Figure 2) if you choose microplate reader.

Figure 1. Sample Preparation for Spectrophotometer

Figure 1. Sample Preparation for Spectrophotometer

Figure 2. Sample Preparation for Microplate Reader

Figure 2. Sample Preparation for Microplate Reader

It is easy to see that the amount of sample required for microplate reader is much fewer than that of spectrophotometer; the amount of sample required also determines the advantages and disadvantages of the two methods. Microplate reader is fast and high throughput, however has a bigger relative error. Spectrophotometer is time-consuming and the operation process is laborious, while the relative error is quite small.

After preliminary experiment, we chose spectrophotometer for our project. We have successfully obtained 9 strains carrying RuXyn1, 1 strain carrying bglX, 13 strains carrying xyn and 2 strains carrying cel5A with high enzyme activity.

How are the reagents prepared?

0.05M NaAc-HAc buffer (pH=5.0): add ddH2O to 1.43mL HAc (l) to reach a final                                                                          volume of 500mL, and add NaOH (s) to                                                                                      pH=5.0

DNS: sequentially add 10.00g DNS, 16.00g NaOH, 5.00g Phenol, 5.00g Na2SO3              and 300.00g C4O6H4KNa to 750mL ddH2O preheated at 45℃, and add                   ddH2O to 1000mL when completely dissolved. Store the reagent in a                         brown reagent bottle and place it at room temperature for at least 7 days                   before use.

Surface co-display of cellulases with synergy in Pichia pastoris (Part V)

Step 8. Genomic PCR analysis

Although the reason why the transparent zone method turns out invalid in our project is not fully understood, the project proceeds with other method. Genomic PCR (Polymerase chain reaction) analysis is used for further screening.

Genomic PCR is PCR using genome as template. This method is used to verify two things: 1) the cellulase gene is truly integrated into the genome of the transformants; 2) the cellulase gene integrated into the genome of our transformants has correct sequence. Genome DNA isolation and genomic PCR are carried out according to standard protocol from Molecular Cloning: A Laboratory Manual (Sambrook J, et al. 2001).

Isolated genome DNA is firstly identified by agarose gel electrophoresis (Figure 1), and secondly used as template in subsequent genomic PCR reaction.

Figure 1. Identification of genome DNA

Figure 1. Identification of genome DNA

The primers we used in genomic PCR reaction system are specific to the cellulase gene (Table 1). If the cellulase gene is truly integrated into the genome of the transformants, the PCR product should be the same size of the corresponding cellulase gene. The size of the PCR product is identified by agarose gel electrophoresis (Figure 2). In negative control, sterile water is used to replace template in the PCR reaction system to avoid the disturbance of primer dimers.

Table 1. Primers used in genomic PCR reaction system

Table 1. Primers used in genomic PCR reaction system

Figure 2. Identification of genome PCR products

Figure 2. Identification of genome PCR product

Transformant with positive genomic PCR result is called recombinant (an organism carrying foreign DNA in its genome via genetic recombination). PCR products of recombinants are sent for sequencing. According to the sequencing result, recombinants carry the correct cellulase gene are used for fermentation.

Step 9. Continuous Fermentation

After resistance selection and genomic PCR analysis, recombinants selected are inoculated into 20mL flasks with 5mL YPD medium, and cultivated at 28℃ 200r/min over night for activation. 1mL bacteria culture is then inoculated into 500mL flasks with 50mL BMMY induction medium for fermentation. The cells are induced for 120h at 28℃ 200r/min. 500uL methanol (1%) is added to the medium every 24h to maintain induction. Aseptic techniques are required in the entire process of fermentation.

Surface co-display of cellulases with synergy in Pichia pastoris (Part IV)

Step 6. Screen for the His+ Mut+ transformants

P.pastoris GS115 transformants are plated on MD (Minimal Dextrose) plates after electroporation. Incubate the plates at 30℃ for 2 days or longer. MD plate contains no histidine, thus can select out strains containing His+. Normally transformants with the phenotype of His+ Mut+ can generate single colonies within three days (Figure 1).

Figure 1. Transformants with the phenotype of His+ Mut+ generate single colonies on MD after incubation for two days

Figure 1. Transformants with the phenotype of His+ Mut+ generate single colonies on MD after incubation for two days

Antibiotic resistance genes in the backbone of expression vectors confer resistance to antibiotic in Pichia pastoris. Strains carry the backbone of pPIC9K and pPICZα are resistant to G418 and Zeocin respectively.The copy number of transformed DNA integrated into the genome of Pichia pastoris ranges randomly from one to multiple. Generally, strains with more copies of integrated DNA have higher enzyme activity as well as higher resistance to antibiotic.

To screen for strains with high enzyme activity, we use sterile toothpicks to patch 200 His+ Mut+ transformants of each kind on new plates (Figure 2). New plates contain medium concentration of antibiotics and are free from selective pressure of lacking histidine. Media and antibiotics are chosen according to the type of plasmid backbone the P.pastoris strains carry. Strains carry pPIC9K backbone are patched on YPD plate containing 2mg/mL G418; strains carry pPICZα are patched on YPDS plate containing 200ug/mL Zeocin. Incubate the plates at 30℃ for 2 days or longer. Transformants with relatively high copy number of transformed DNA yield large circular colonies (e.g. colony 31 in figure 2), while others remain small dots (e.g. colony 70 in figure 2).

Figure 2. patched YPD plate containing 2mg/mL G418 after incubation for 2 days

Figure 2. patched YPD plate containing 2mg/mL G418 after incubation for 2 days

Step 7. Screen for transformants with high enzyme activity

It’s laborious and time consuming to do fermentation and enzyme activity assay, so further screenings are required to screen for transformants with high enzyme activity.

Transformants obtained after resistance selection are patched on new BMMY (medium for fermentation) plates containing substrate to corresponding enzyme; we use xylan (birchwood), common substrate of all the four cellulases we are studying. Xylose is the decomposition product of xylan. Xylan can be stained by Congo red, a dye, while xylose can’t. Congo red is added into the medium with the terminal concentration of 5mg/100mL. If the strain expresses functional cellulase, the colony will yield a circular transparent zone around (Figure 3). The strain expresses cellulase with higher activity yields transparent zone with larger diameter.

Figure 4. schematic of a Congo red screening plate.

Figure 3. Schematic of a Congo red screening plate.

Patched Congo red screening plates are incubated at 30℃. The expression of cellulase is under the regulation of inducible promoter, PAOX1. 200uL methanol is added to the plate everyday to induce the expression of cellulase.

Figure 4. Congo red screening plates after five days of induction and incubation

Figure 4. Congo red screening plates after five days of induction and incubation

Unfortunately, none of our transformants yield any transparent zone after five days of induction and incubation (Figure 4); however, it doesn’t necessarily mean our transformants can’t express functional cellulase. There are many possible reasons for the failure of yielding transparent zones: 1) cellulases have many possible substrates, while xylan is not the most suitable one; 2) methanol is not the only carbon source in our BMMY medium. Other carbon sources are used prior to methanol by P.pastoris GS115, which prevents the transformants from being induced. 3) The activity of cellulases expressed by our transformants is below the threshold of the transparent zone method.

Composition of media used in our project

MD: 1.34 % YNB, 4×10⁻⁵ % biotin, 2 % dextrose, and 1.5 % agar

YPD: 1 % yeast extract, 2 % peptone, and 2 % glucose

YPDS: 1 % yeast extract, 2 % peptone, 2 % glucose, and 1M sorbitol

BMGY/BMMY: 1 % yeast extract, 2 % peptone, 100 mM potassium phosphate,                                        pH 6.0, 1.34 % yeast nitrogen base [YNB], 4×10⁻⁵ % biotin, and                                    1 % glycerol or 0.5 % methanol

Surface co-display of cellulases with synergy in Pichia pastoris (Part III)

Step 3. Determine the sequence of the plasmid by sequencing

There’s a chance of gene mutation during the process of vector construction. The precise order of nucleotides within our vector is determined by DNA sequencing. Plasmid samples are sent to TSINGKE Biological Technology (other companies with sequencing services are also okay). We get reports of the sequences of our samples; and use BLAST to do sequence alignment.

The BLAST result of RuXyn1

The BLAST result of RuXyn1

Our BLAST result of RuXyn1 is shown in the image above, indicating that the sequence of RuXyn1 in our sample is correct. The sequencing results of the other three enzyme genes (Xyn, BglX, Cel5A) are processed in the same way. If the sequencing result shows that the gene mutated, the vector should be reconstructed until you get the correct sequence.

Step 4. Linearize the plasmid to stimulate recombination

Linearization is to use restriction enzyme to digest and linearize the circular plasmid. Linearized DNA can generate stable transformants of Pichia pastoris via homologous recombination between the transforming DNA and regions of homology within the genome. Such integrants show extreme stability in the absence of selective pressure even when present as multiple copies.

The type of restriction enzyme used in linearization is determined both by the type of the host cell (Pichia Pastoris strain GS115 or KM71) and the phenotype of transformants (His+ Mut+ or His+ Muts). His+ represents the “Histidine synthesizing” phenotype, Mut+ represents the “Methanol utilizing” phenotype and Muts refers to the “Methanol utilization slow” phenotype.

The Pichia Pastoris strain GS115 is used as host cell in our project. GS115 has a mutation in its histidinol dehydrogenase gene (his4) that prevents it from synthesizing histidine (His). Both pPIC9K and pPICZα contain the HIS4 gene that complements his4 in the host cell (His+), thus transformants are selected for their ability to grow on histidine-deficient medium. We use Sal I and Sac I to linearize our expression vectors, pPIC9K (Figure 1) and pPICZα (Figure 2) respectively, according to Pichia Expression Kit (page32, Invitrogen).

Linearization of pPIC9K by Sal I

Figure 1. Linearization of pPIC9K by Sal I

Linearization of pPICZα by Sac I

Figure 2. Linearization of pPICZα by Sac I

Linearized plasmids are identified by agarose gel electrophoresis. Circular DNA runs faster than linearized DNA with the same primary structure. Here I take the linearization of pPIC9K-RuXyn as an example (Figure 3). We use the plasmid without enzyme digestion (pPIC9K-RuXyn) as negative control (R0), which runs ahead of the linearized DNA (RuXyn) in the agarose gel.

Figure 3. Identification of linearization of pPIC9K-RuXyn

Figure 3. Identification of linearization of pPIC9K-RuXyn

Step 5. Electroporation for the first round

Electroporation is to use electrical field to introduce the expression vector into the yeast cell. One kind of expression vector is introduced into the cell in one round of electroporation. Two rounds of electroporation are required, for we want to co-transform two enzyme genes into Pichia pastoris and co-display the two enzymes.

We use the method in Pichia Expression Kit (page 77, Invitrogen) to prepare electro competent cells and electroporation. pPIC9K-RuXyn, pPIC9K-BglX, pPICZα-Xyn and pPICZα-Cel5A are introduced into P. pastoris GS115 to construct GS115-9K-RuXyn, GS115-9K-BglX, GS115-Zα-Xyn and GS115-Zα-Cel5A. pPIC9K and pPICZα, both carry Sed1p only, are also introduced into P. pastoris GS115 to construct GS115-9K and GS115-Zα, which function as the negative control for Immunofluorescence Assay and Flow Cytometry analysis.

Surface co-display of cellulases with synergy in Pichia pastoris (Part II)

Among all the cellulases targeting different chemical bonds in lignocellulose, our group found two sets with synergy in the literature. Synergy in this context is a property that the two enzymes can enhance the activity of each other when functioning together. The first set is RuXyn1 (beta-D-xylosidase) and Xyn (beta-xylanase); and the second set is BglX (beta-glucosidase) and Cel5A (endoglucanase). The two sets of cellulases are responsible for degrading hemicellulose and cellulose respectively.

As for lignin, an aromatic polymer, pretreatment is required to remove this lignin from cellulose and hemicellulose. Without the protection of lignin, cellulose and hemicellulose will lose their resistance to enzymes and can be more easily degraded. Previous studies gave many options of enzymes used for pretreatment, such as Lip (Lignin peroxidase), MnP (Mn peroxidase) and GLOX (Glyoxal oxidase). So, our project focused on the degradation of cellulose and hemicellulose.

The process of constructing the surface co-display system is as follows.

Step 1. Choose a proper host cell and the corresponding anchor protein

As cellulases are all originated from fungi, we need a eukaryotic expression system. Pichia pastoris and Saccharomyces cerevisiae are both modern frequently used eukaryotic expression systems. We chose Pichia pastoris in our project, because it has several advantages over Saccharomyces cerevisiae: 1) it’s modification ability is stronger, capable of peptide folding, glycosylation, methylation and acetylation; 2) it contains promoter PAOX1, the regulation of which is the most efficient and strictest among the promoters discovered currently; 3) exogenous genes transformed into Pichia pastoris integrate into its genome, expressing steadily; while genes transformed into Saccharomyces cerevisiae  exist as plasmid that is very likely to be rejected by the cell after several generations.

pPIC9K and pPICZα are both good expression vectors in Pichia pastoris, but not all the cells transformed with the vector can successfully express the target protein on its surface. To reach a high activity of our whole-cell catalyst, we want the display ratio (the amount of cells expressing the target protein on the surface/ total cells) as high as possible, which depends on both the expression vector and the anchor protein. In our lab, the accessible candidates are Cwp2p, Sed1p and α-agglutinin. We expressed the candidates fused with EGFP (Enhanced Green Fluorescent Protein) based on pPIC9K and pPICZα respectively; and use FCM (Flow Cytometry) to test their display ratio. From our experiments we found that Sed1p is the best, with the display ratio of 99.50% in pPIC9k and 98.36% in pPICZα.

Step 2. Construct the expression vectors

pPICZα-Cel5A/ Xyn-sed1

Figure 1. pPICZα-Cel5A/ Xyn-sed1

Figure 2. pPIC9K-RuxynBglX-sed1

Figure 2. pPIC9K-RuxynBglX-sed1

The plasmid profiles are shown in figure 1 and 2. α factor signal is a secretion signal; PAOX1 is an induced promoter (functions only in the presence of specific inductor) sensitive to methanol. EcoR I, Mlu I and Not I are restriction sites used for the vector construction. We add a tag (FLAG tag or HA tag) to the target gene for the detection of the target protein.

Tags have their specific primary antibody. The primary antibody can be recognized by the secondary antibody through antigen-antibody reaction. The secondary antigen is labeled by fluorescent. Thus we can detect the target protein by detecting the fluorescence on the cell surface under the fluorescence microscope. To distinguish the two target proteins, we use two different tags (FLAG tag and HA tag). Different tags correspond to different primary and secondary antibodies, emitting fluorescence of different color.

Figure 3. Surface Co-display Systems

Figure 3. Surface Co-display Systems

Figure 3 is the schematic of the two surface co-display systems. pPIC9K has resistance against ampicillin and kanamycin, while pPICZα is resistant to zeocin. Notice that two enzyme genes co-expressed in one cell type are constructed in two different plasmid backbones; we can easily obtain the strain with both two expression vectors by resistance screening assay.

According to the plasmid backbone and the inserted gene, we name the four expression vectors pPIC9K-RuXyn, pPIC9K-BglX, pPICZα-Xyn and pPICZα-Cel5A.

Surface co-display of cellulases with synergy in Pichia pastoris (Part I)

From April 2013 to May 2014, I worked as a research assistant in the Key Laboratory of Molecular Biophysics of Ministry of Education, HUST; I led my independent research team to build two surface co-display systems of cellulases in Pichia pastoris.

Lignocellulose refers to plant dry matter (biomass). It is the combination of three different polymers (cellulosehemicellulose and lignin); both cellulose and hemicellulose are carbohydrate polymers and they bind tightly to lignin (an aromatic polymer).

Lignocellulose is the most abundant resource of biomass on the earth. Unfortunately, people hardly use it. Why? Because lignocellulose is formed by many different monomers via different chemical bonds; while one enzyme can only break one kind or one family of chemical bonds. Since monosaccharides are the primary materials for bio-fuels, such as bio-ethanol, a large number of enzymes are required for the complete degradation.

Scientists do have discovered many kinds of cellulases in nature; and they are in charge of breaking different chemical bonds respectively. You may ask, “Why not we just add all the enzymes needed?” This is truly a solution, but the purification of so many enzymes is very expensive, laborious and time-consuming. So traditionally, people just discard or burn lignocellulose (e.g. dead wood, straw and bran) as waste.

Surface display of enzymes is a novel solution to the problem. Surface display technique is to express the target protein as a fusion protein with the anchor (protein originally located on the surface of the cell), thus the target protein can be located on the surface of the cell rather than secreted into the medium. The beauty of the technique is that the whole cell will act as the catalyst; there’s no need to purify the target protein (enzyme). Considering the low recovery of purification, whole-cell catalyst is efficient as well as convenient. Moreover, the restoration of cells is a lot easier than that of proteins.

Surface Display in Pichia pastoris

Surface Display in Pichia pastoris

Our team added a GS linker (a short soft peptide consisting of Glycine and Serine) between the target protein and the anchor to ensure that there’s no interference in the folding and the function of the two proteins.

Remember that many kinds of proteins located on the cell surface are candidates of the anchor; the specific location of the anchor is not necessarily in the cell wall as shown in the image above, it also can be located in the cytomembrane or the intermembrane space.