
Bells of Nagasaki, Dr. Nagai

Song for Nagasaki
Bells of Nagasaki, Dr. Nagai
Song for Nagasaki
Trends in Molecular Medicine, April 2019 (Cover Story)
https://doi.org/10.1016/j.molmed.2019.01.009

Xue Zeng, Ava Hunt, Sheng Chih Jin, Daniel Duran, Jonathan Gaillard, and
Kristopher T. Kahle
Neuron 101, 1–15, February 6, 2019
https://doi.org/10.1016/j.neuron.2018.11.041
Daniel Duran*, Xue Zeng*, Sheng Chih Jin*, Jungmin Choi*, Carol Nelson-Williams, Bogdan Yatsula, Jonathan Gaillard, Charuta Gavankar Furey, Qiongshi Lu, Andrew T. Timberlake, Weilai Dong, Michelle A. Sorscher, Erin Loring, Jennifer Klein, August Allocco, Ava Hunt, Sierra Conine, Jason K. Karimy, Mark W. Youngblood, Jinwei Zhang, Michael L. DiLuna, Charles C. Matouk, Shrikant Mane, Irina R. Tikhonova, Christopher Castaldi, Francesc López-Giráldez, James Knight, Shozeb Haider, Mariya Soban, Seth L. Alper, Masaki Komiyama, Andrew F. Ducruet, Joseph M. Zabramski, Alan Dardik, Brian P. Walcott, Christopher J. Stapleton, Beverly Aagaard-Kienitz, Georges Rodesch, Eric Jackson, Edward R. Smith, Darren B. Orbach, Alejandro Berenstein, Kaya Bilguvar, Miikka Vikkula, Murat Gunel, Richard P. Lifton, Kristopher T. Kahle
* Co-first Author
Neuron 99, 1–13, July 25, 2018 (Cover Story)
https://www.sciencedirect.com/science/article/pii/S0896627318304872
Charuta Gavankar Furey*, Jungmin Choi*, Sheng Chih Jin#, Xue Zeng#, Andrew T. Timberlake, Carol Nelson-Williams, M. Shahid Mansuri, Qiongshi Lu, Daniel Duran, Shreyas Panchagnula, August Allocco, Jason K. Karimy, Arjun Khanna, Jonathan, R. Gaillard, Tyrone DeSpenza, Prince Antwi, Erin Loring, William E. Butler, Edward R. Smith, Benjamin C. Warf, Jennifer M. Strahle, David D. Limbrick, Phillip B. Storm, Gregory Heuer, Eric M. Jackson, Bermans J. Iskandar, James M. Johnston, Irina Tikhonova, Christopher Castaldi, Francesc López-Giráldez, Robert D. Bjornson, James R. Knight, Kaya Bilguvar, Shrikant Mane, Seth L. Alper, Shozeb Haider, Bulent Guclu, Yasar Bayri, Yener Sahin, Michael L.J. Apuzzo, Charles C. Duncan, Michael L. DiLuna, Murat Günel, Richard P. Lifton, and Kristopher T. Kahle
* Co-First Author, # Co-Second Author
Nature Genetics, vol. 49, pages 1593–1601 (2017)
https://www.nature.com/articles/ng.3970

Sheng Chih Jin*, Jason Homsy*, Samir Zaidi*, Qiongshi Lu, Sarah Morton, Steven R DePalma, Xue Zeng, Hongjian Qi, Weni Chang, Michael C Sierant, Wei-Chien Hung, Shozeb Haider, Junhui Zhang, James Knight, Robert D Bjornson, Christopher Castaldi, Irina R Tikhonoa, Kaya Bilguvar, Shrikant M Mane, Stephan J Sanders, Seema Mital, Mark W Russell, J William Gaynor, John Deanfield, Alessandro Giardini, George A Porter Jr, Deepak Srivastava, Cecelia W Lo, Yufeng Shen, W Scott Watkins, Mark Yandell, H Joseph Yost, Martin Tristani-Firouzi, Jane W Newburger, Amy E Roberts, Richard Kim, Hongyu Zhao, Jonathan R Kaltman, Elizabeth Goldmuntz, Wendy K Chung, Jonathan G Seidman, Bruce D Gelb, Christine E Seidman, Richard P Lifton & Martina Brueckner
* Co-First Author
2014 is the 10th Anniversary of iGEM Competition. To celebrate the 10th Anniversary, from October 31st to November 3rd, we had a Giant Jamboree at Hynes Convention Center, Boston, MA. Unlike previous year’s competition’s two-tiered structure, in 2014, there are no more Regional Jamborees; everyone can come to Boston to enjoy the gathering and share their ideas and accomplishments with iGEMers from all over the world.
This year, HUST_China focused on treating sewage containing copper ion, cyanide and fluoride, the main common pollutants in industrial waste water. To reach the goal, we designed and constructed E. kungfu, which is capable of absorbing copper ion, degrading cyanide and detoxifying fluoride. Why do we call our engineered bacteria E. kunfu? Because they are so potent in defeating bad guys (pollutants) and recovering valuable resources (copper ion), which well represents the characteristics of Chinese kungfu.
E. kungfu is actually consisted of two strains of biologically engineered E. coli, one is E. worker (Figure 1) and the other is E. instructor (Figure 2).
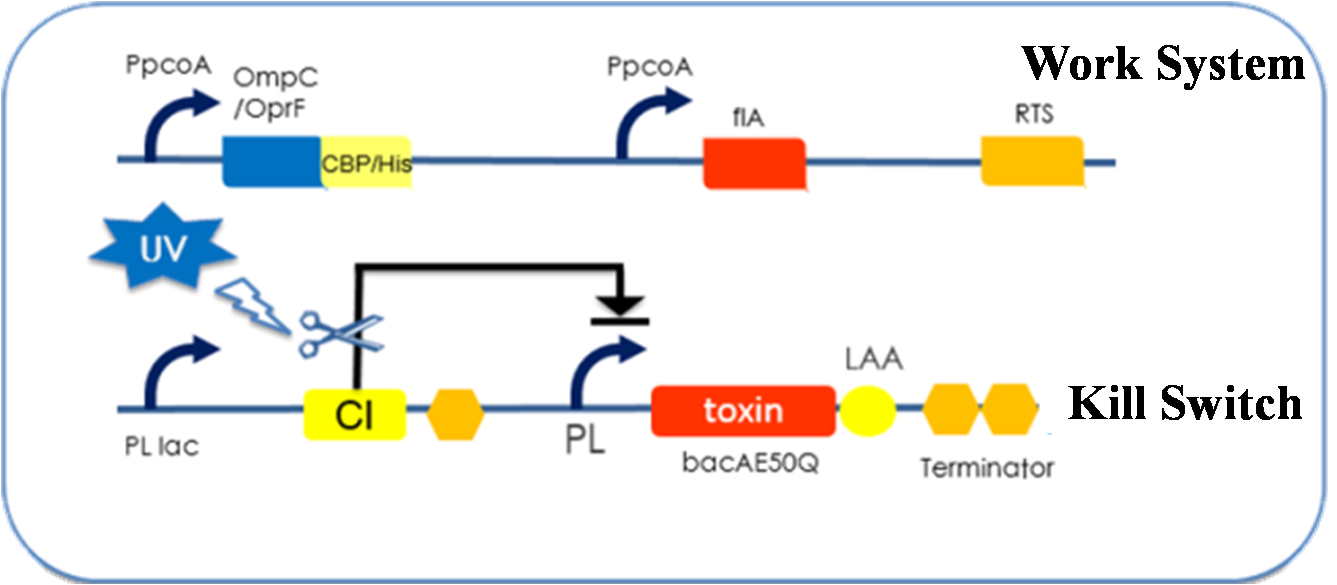
Figure 1. E. worker
E. worker functions as a worker that treats sewage containing copper ion, cyanide and fluoride; it is consisted of a work system and a kill switch.
The work system carries genes encoding a copper binding protein, a fluorinase (flA) and an operon that is capable of degrading cyanide (RTS). The copper binding protein is displayed on the cell surface (see surface display system); it is composed of a copper binding peptide and an anchor protein of the cell membrane/wall. According to our experimental results, both OmpC and OprF function well as the anchor protein, and both CBP and 6×His tag are good choices of copper binding peptide. All the functional parts in the work system are under the regulation of an induced promoter- PpcoA, which is sensitive to the concentration of copper ion; the work system is active only in condition of high copper ion concentration.
The kill switch is added to our E. worker out of the concern for biosafety. Our E. worker can express toxin protein and kill itself when exposed to high intensity of UV, thus the application range of the bacteria is fully under the control of the user. The working mechanism of the kill switch is a little complex; please click here to view the detail.
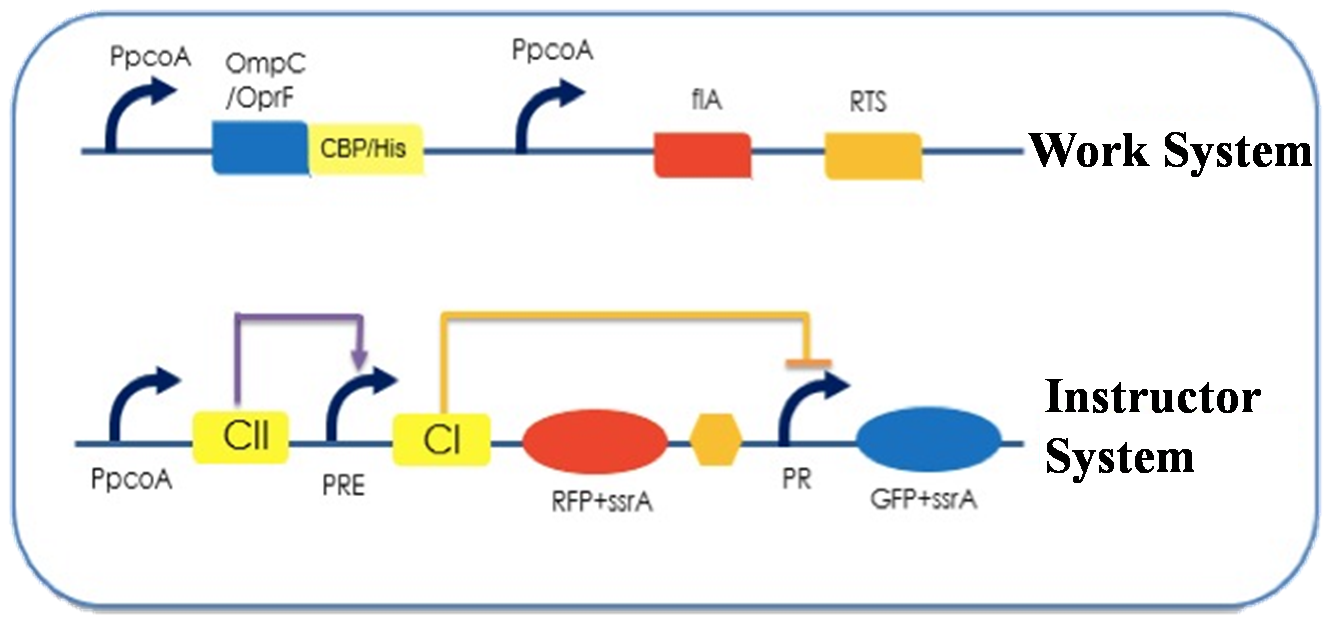
Figure 2. E. instructor
E. instructor works as a reporter of the whole system, telling the user whether the sewage is treated completely; it is consisted of a work system and an instructor system.
The work system in E. instructor is exactly the same as the one in E. worker; but it is not designed for treating sewage, instead it is used to ensure that our bacteria can survive in high concentration of pollutants.
The instructor system expresses RFP when the copper ion concentration is high, while expresses GFP when the copper ion concentration is low. Users can decide whether the sewage is treated completely according to the color of the fluorescent protein. Click here to know the detailed working mechanism of our instructor system.
Here is 2014 iGEM project poster (Figure 3) by team HUST_China. Click the picture, then you can view details.
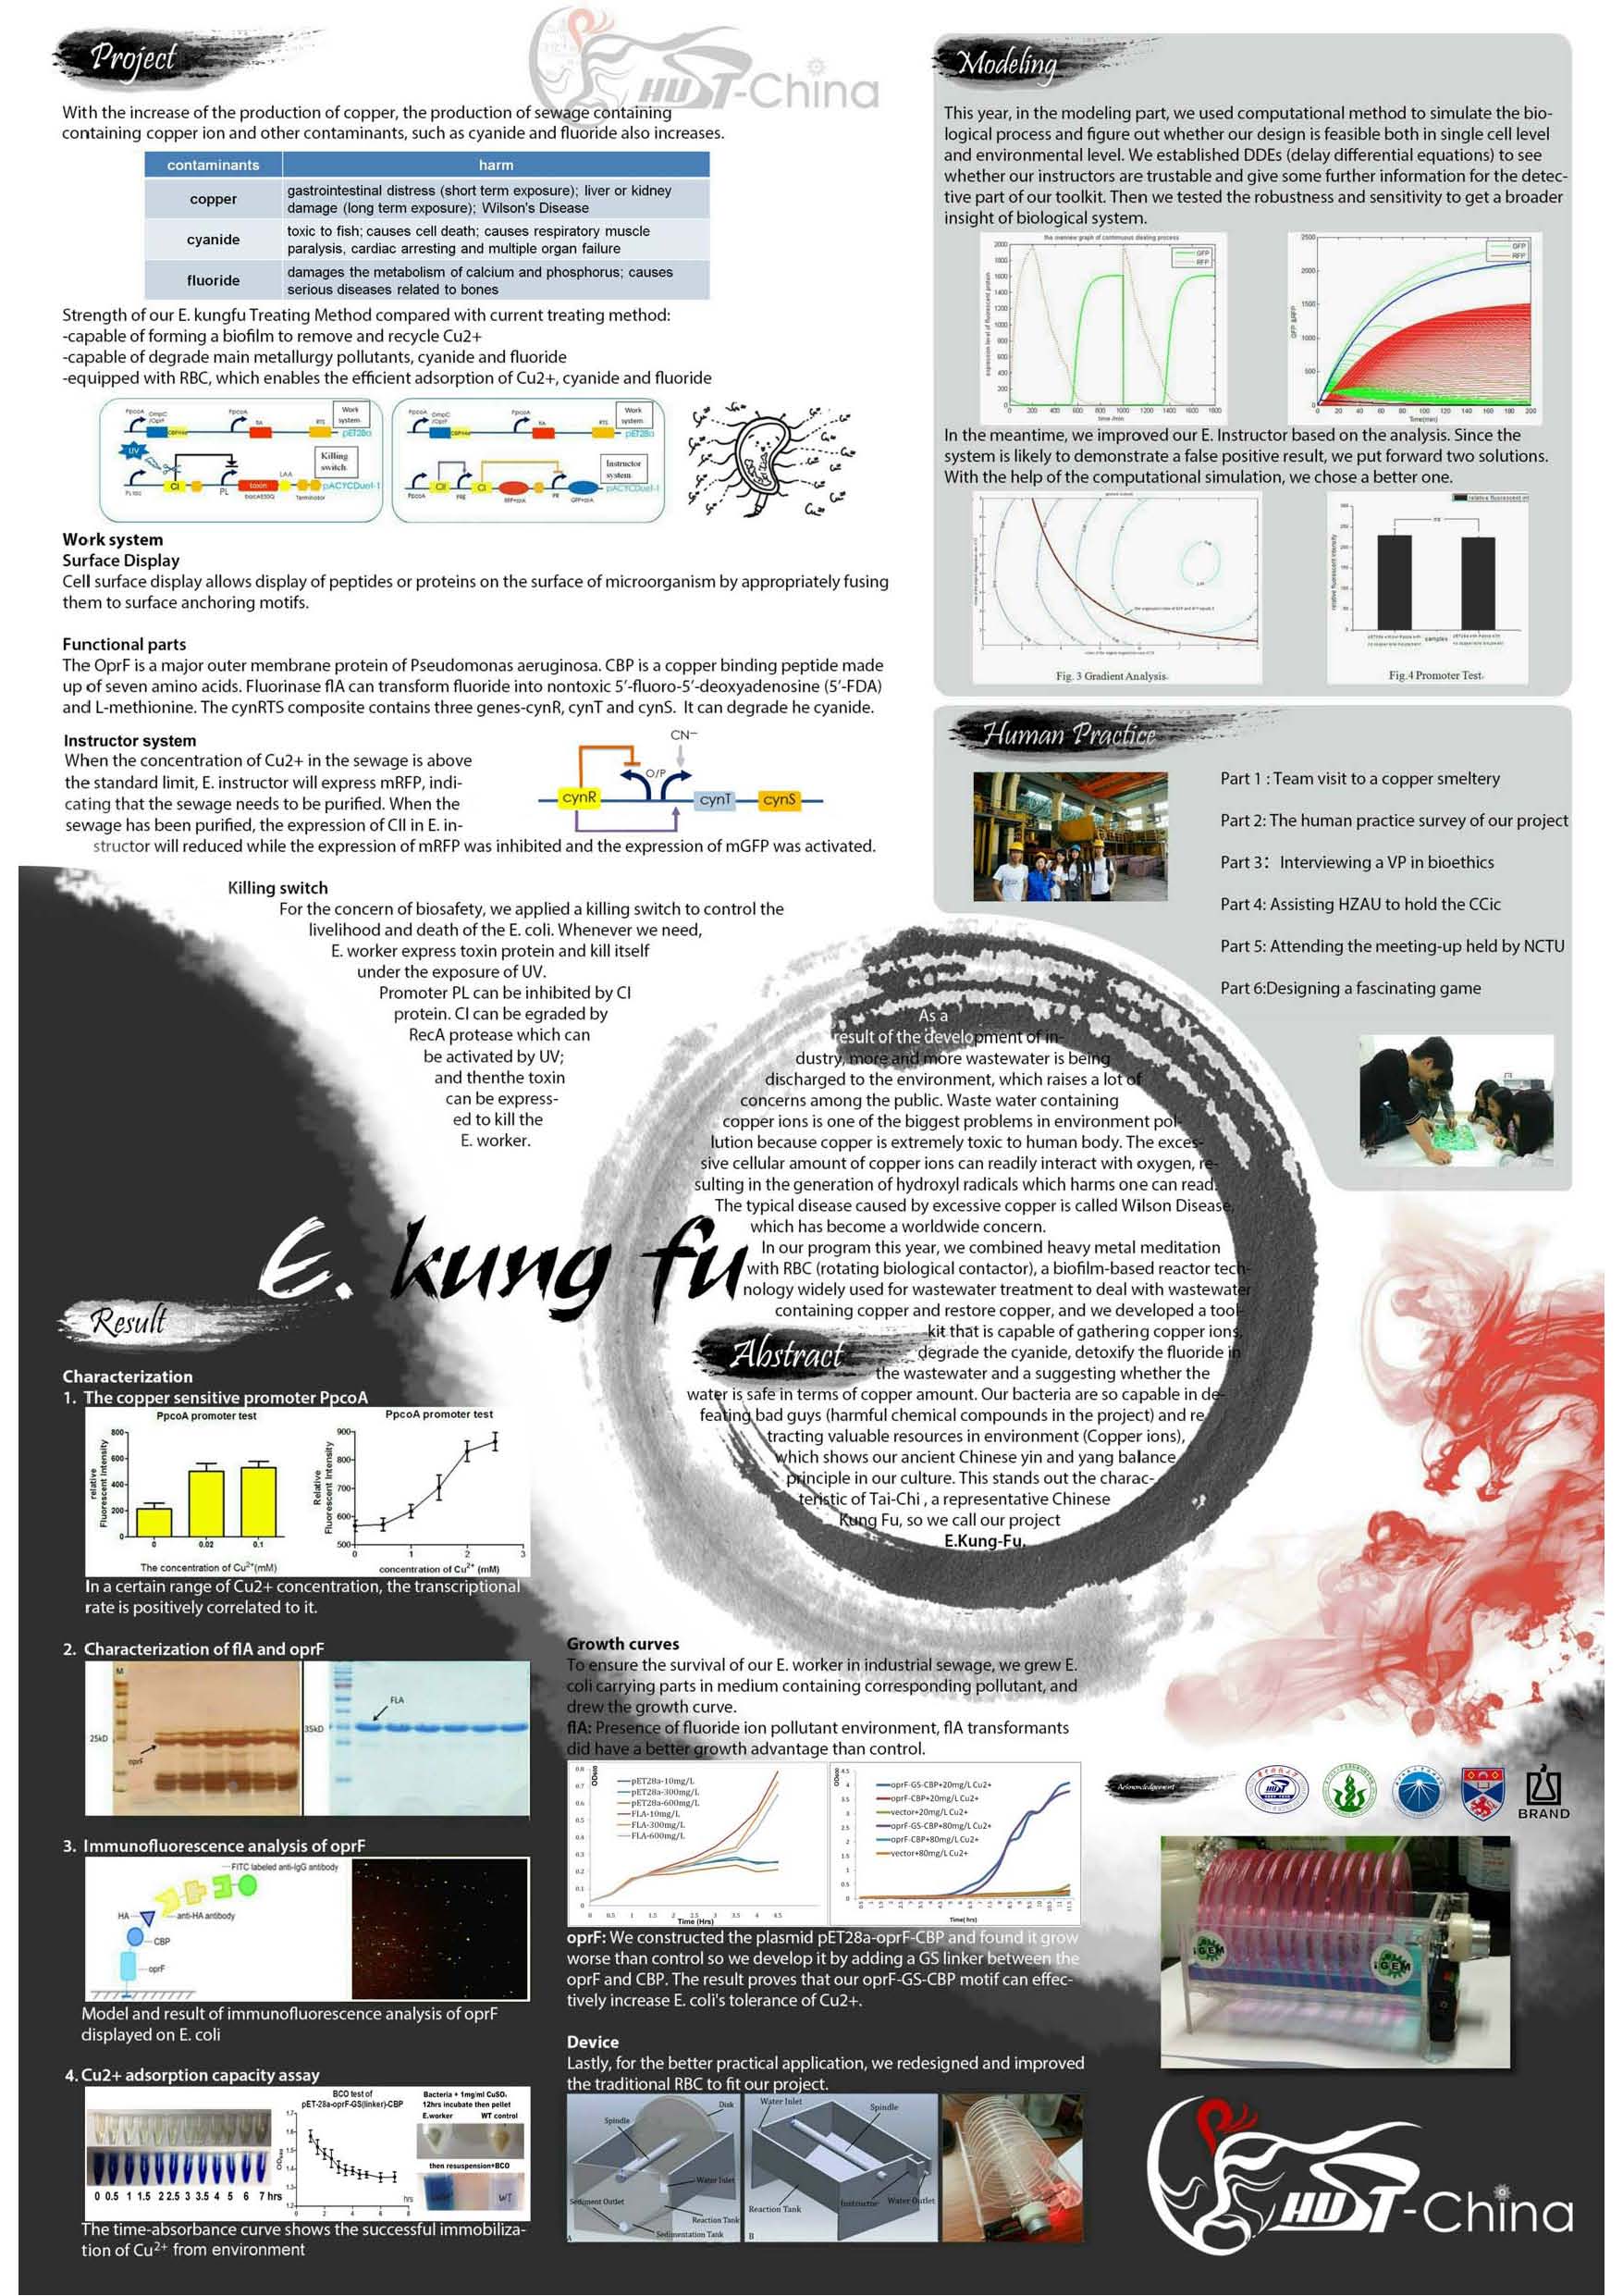
Figure 3. 2014_iGEM Poster
It is exciting to obtain strains with high enzyme activity, but do cellulases truly locate on the surface of our Pichia pastoris? We need further experiments for verification.
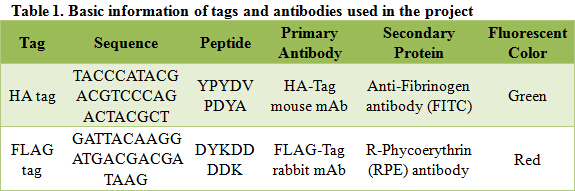
As described in my previous post (Surface co-display of cellulases with synergy in Pichia pastoris (Part II)), our cellulases are expressed with a tag (Table 1), which can bind specifically to their primary and secondary antibodies, thus be detected by immunofluorescence assay.
Take 2mL enzyme solution and collect cells by centrifugation at 4℃, 12000rpm for 1 minute. Wash cells twice with ice cold PBS buffer (pH=7.4). Resuspend the cells in 250μL 1mg/mL BSA (dissolved in PBS buffer (pH=7.4)), and add 2μL (approximately 1μg) primary antibody into the mixture. React cells with primary antibody for 2 hours on ice or overnight at 4℃. After reaction, centrifuge and remove the liquid, then wash cells twice with ice cold PBS buffer (pH=7.4). Resuspend the cells in 250μL 1mg/mL BSA (dissolved in PBS buffer (pH=7.4)), and add 2μL (approximately 1μg) secondary antibody into the mixture. React cells with secondary antibody in dark place for 2 hours on ice (remember to mix the reaction mixture every 20 minutes). After reaction, centrifuge and remove the liquid, then wash cells twice with ice cold PBS buffer (pH=7.4). By now, secondary antibody has bound to our cellulase in ideal condition. To view cells under fluorescence microscope, resuspend cells in 500μL ice cold PBS buffer (pH=7.4), add 5μL resuspended cells to a clean and dry slide, affix a piece of coverslip to the slide and allow the coverslip to dry in the dark before viewing.
Data are meaningless without a proper control. When the concentration of the antibody is too high, non-specific binding can still exist even after several times of washing; the secondary antibody can even bind directly to cells with no cellulases on their surfaces! Pichia pastoris strains carrying the backbone of vectors (pPIC9K or pPICZα) are used as negative control; their treating processes are exactly the same as our samples.
Besides negative controls, we also need pictures in bright field for both samples and controls; they are used to confirm that 1) what you are viewing is truly cells; 2) the only reason you see nothing in control groups is that no secondary antibody binds to the cells.

Figure 1. Immunofluorescent Assay of pPIC9K-HA-BglX and pPICZα-FLAG-Cel5A
As shown in bright field, in both sample groups (Figure 1- pPIC9K-HA-BglX and Figure 1-pPICZα-FLAG-Cel5A ) and control groups (Figure 1-pPIC9K and Figure 1-pPICZα), there are cells on slides. However, fluorescence can only be seen in sample groups, indicating that our cellulases really locate on the surface of Pichia pastoris.
Besides knowing the location of our cellulases, we also want to know how many of our Pichia pastoris have cellulases displayed on their surfaces. To acquire this knowledge, we need flow cytometry analysis.
Flow cytometry is a fast and high throughput method that can scan single cells flowing past excitation sources in a liquid medium, and classify cells based on the measurement of fluorescent light emission. In other words, flow cytometry analysis can divide our cells into two groups; one displays cellulases on their surface (with fluorescent light emission), the other does not (without fluorescent light emission).
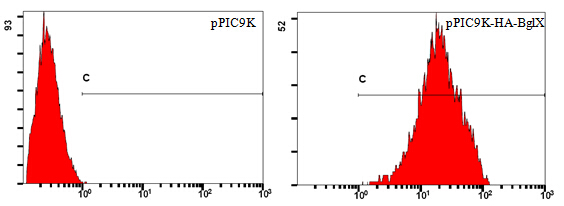
Figure 2. Flow Cytometry Analysis of pPIC9K-HA-BglX and pPIC9K
Take pPIC9K-HA-BglX as an example (Figure 2). Cells carrying the backbone of pPIC9K are used as negative control. Numbers on horizontal axis represent relative fluorescent intensity of single cells, which are proportional to the amount of cellulases displayed on single cells. Vertical axis shows relative quantity of cells.
Lines in both pictures are identical; its left end corresponds to the highest fluorescent intensity of single cells in the control group. Single cells in the sample group, which have higher fluorescent intensity than the highest fluorescent intensity in the control group, are considered truly displaying cellulases on their surfaces. The percentage of cells display cellulases on their surfaces can be read directly using professional software, like FlowJo.
As cellulase is supposed to display on the surface of Pichia pastoris, we will directly conduct the enzyme activity assay using collected cells.
We take 5mL fermentation liquid from 500mL flask used for continuous fermentation and put it into a 7mL tube. Cells are then collected by centrifugation at 4℃. Supernatant in the tube are discarded, and sediment (cells) is washed by 0.05M NaAc-HAc buffer (pH=5.0) for twice. After washing, cells are resuspended by 0.05M NaAc-HAc buffer (pH=5.0) to OD600=5 for enzyme activity assay.
Different cellulases have different properties, including substrate specificity, optimum pH and temperature, etc, thus require different conditions for enzyme activity assays. Conditions we use for each cellulase in this project are recorded in Table 1.
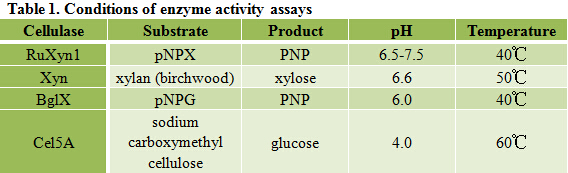
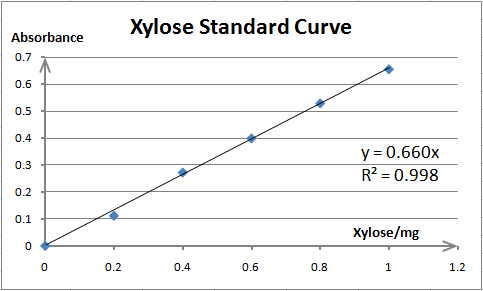
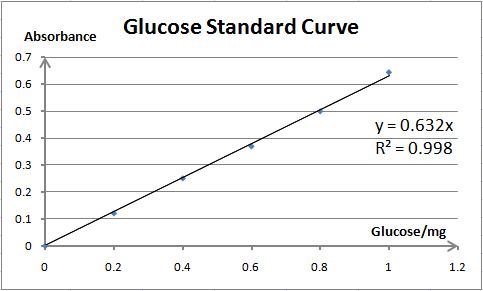
Cellulase activity is assayed by measuring the amount of product (xylose, glucose or PNP) released from corresponding substrate. The amount of product is determined by spectrophotometry. As spectrophotometry has a limited linear range, we need to make standard curves for each substrate before enzyme activity assays; thus, we can prepare samples whose concentration is qualified for reliable measurement. Also, standard curves are necessary for our converting absorbance to specific amount of product.
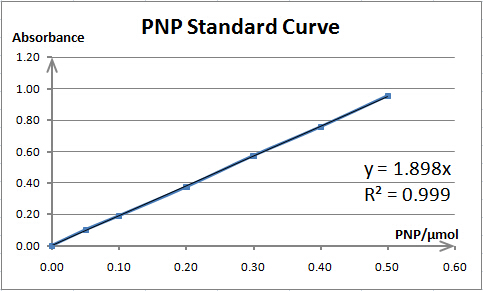
The total reaction system of 1mL contains 0.1mL enzyme solution (resuspended cells) and 0.9mL 5mmol/L pNPX (p-nitrophenyl-D-xylopyranoside) (dissolved in 0.05M NaAc-HAc buffer (pH=5.0)). For preheating, the reaction system is incubated at 40℃ for 5 minutes before the addition of enzyme solution. After incubation at 40℃ for 10 minutes, the reaction was terminated by adding 2mL 1mol/L Na2CO3. To reach a proper concentration for measurement, the reaction solution is diluted by adding ddH2O to 15mL. The RuXyn1 activity is determined by measuring the absorbance at 400nm. The background hydrolysis of the substrate is deducted by a reference sample whose content and treating process are exactly the same as the reaction mixture except no enzyme solution is added. One unit (U) of enzyme activity is defined as the amount of enzyme required for releasing 1μmol of PNP per minute.
The total reaction system of 1mL contains 0.1mL enzyme solution (resuspended cells) and 0.9mL 1% xylan (birchwood) (dissolved in 0.05M NaAc-HAc buffer (pH=5.0)). The preheating, reaction and incubation processes are the same as RuXyn1 activity assay, except that the temperature is 50℃ for Xyn. After incubation, 3mL DNS is added to the reaction mixture, and the following reaction is carried out in boiling water bath. After 5 minutes of reaction, tubes are taken out from boiling water and cooled in cold water. The Xyn activity is determined by measuring the absorbance at 540nm. The background hydrolysis of the substrate is deducted by a reference sample whose content and treating process are exactly the same as the reaction mixture except no enzyme solution is added. One unit (U) of enzyme activity is defined as the amount of enzyme required for releasing 1mg of xylose per minute.
As BglX and RuXyn1 have the same reaction product, PNP, their activity assays are also quite similar, except that the substrate for BglX is pNPG (p-nitrophenyl-D-glucoside) (dissolved in 0.05M NaAc-HAc buffer (pH=5.0)). One unit (U) of enzyme activity is also defined as the amount of enzyme required for releasing 1μmol of PNP per minute.
As the reaction product of Cel5A and Xyn are both monosaccharide (glucose and xylose, respectively), their activity assays are also quite similar, except that the substrate for Cel5A is 1% sodium carboxymethyl cellulose (dissolved in 0.05M NaAc-HAc buffer (pH=5.0)), and the optimum temperature is 60℃. One unit (U) of enzyme activity is defined as the amount of enzyme required for releasing 1mg of glucose per minute.
As for measuring absorbance, you can either use microplate reader or spectrophotometer. The processes of sample preparation are similar – use tubes (Figure 1) if you choose spectrophotometer, use 96-well plates (Figure 2) if you choose microplate reader.
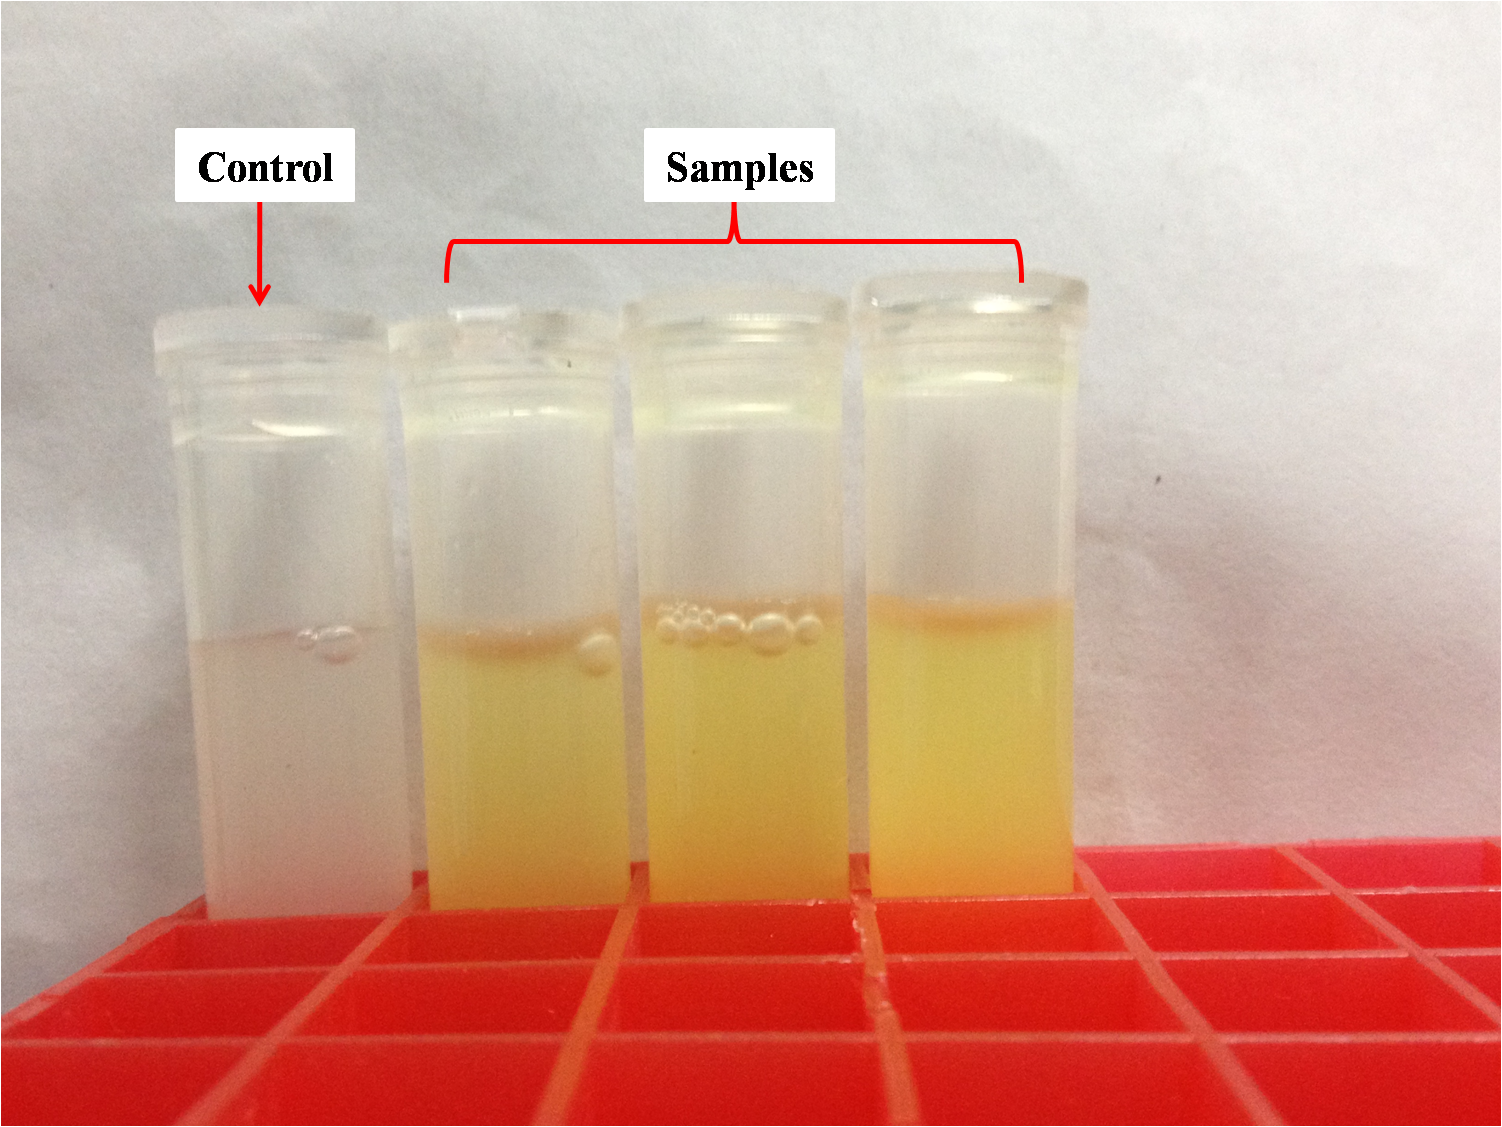
Figure 1. Sample Preparation for Spectrophotometer
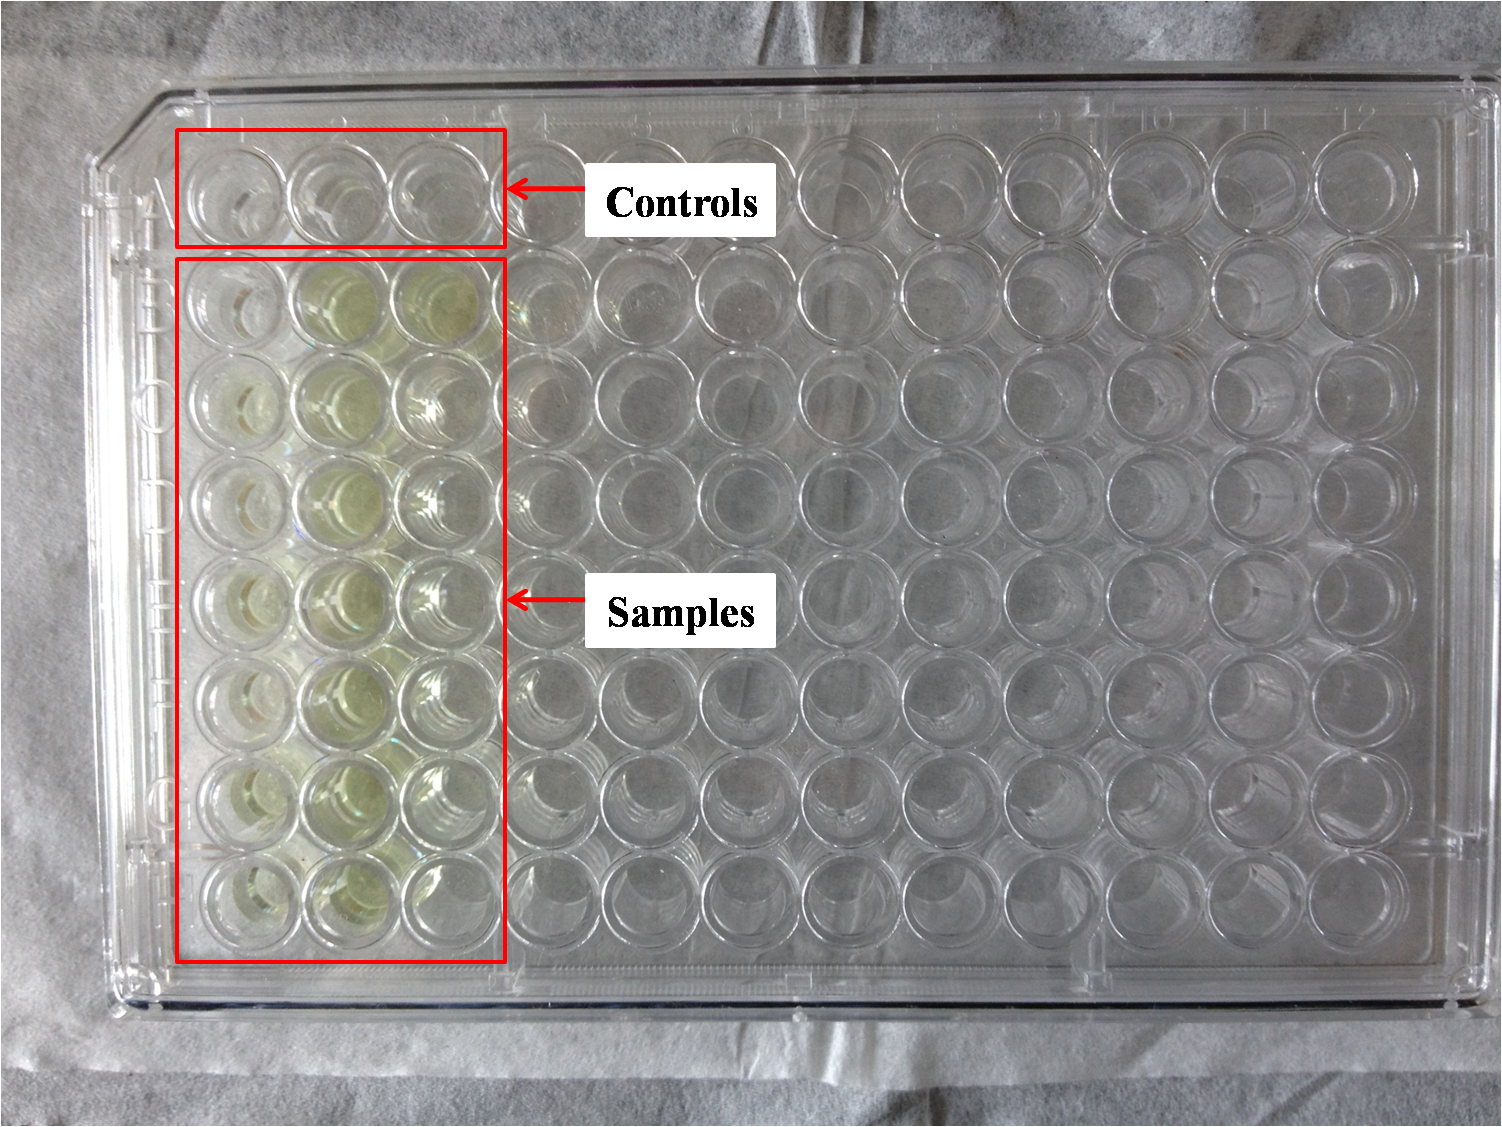
Figure 2. Sample Preparation for Microplate Reader
It is easy to see that the amount of sample required for microplate reader is much fewer than that of spectrophotometer; the amount of sample required also determines the advantages and disadvantages of the two methods. Microplate reader is fast and high throughput, however has a bigger relative error. Spectrophotometer is time-consuming and the operation process is laborious, while the relative error is quite small.
After preliminary experiment, we chose spectrophotometer for our project. We have successfully obtained 9 strains carrying RuXyn1, 1 strain carrying bglX, 13 strains carrying xyn and 2 strains carrying cel5A with high enzyme activity.
0.05M NaAc-HAc buffer (pH=5.0): add ddH2O to 1.43mL HAc (l) to reach a final volume of 500mL, and add NaOH (s) to pH=5.0
DNS: sequentially add 10.00g DNS, 16.00g NaOH, 5.00g Phenol, 5.00g Na2SO3 and 300.00g C4O6H4KNa to 750mL ddH2O preheated at 45℃, and add ddH2O to 1000mL when completely dissolved. Store the reagent in a brown reagent bottle and place it at room temperature for at least 7 days before use.