When identifying the function of a protein, confirming the upstream and downstream events of a pathway, it is necessary to understand the interactions between the target protein and other proteins. Pull down assay is a good way to detect both known and unknown interactions.
In the pull down assay, the target protein is expressed with a fusion tag as the bait. The source of the prey depends on the purpose of the study; the prey can be either known or unknown, either one or more than one. There are several types of tags, such as GST (Glutathione S-transferase) tag, 6× polyhistidine tag and Halo tag; your choice depends on the source and the property of the target protein.
Here I will use GST-based pull down as an example.What we need is a bait (X protein fused with a GST tag), a prey (Y protein) and agarose beads containing reduced GSH (Glutathione).
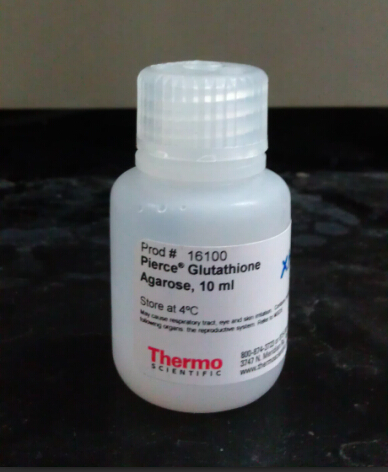
Pierce Glutathione Agarose Beads
The bead our lab uses is Thermo Scientific Pierce Glutathione Agarose; you can find all the parameters and instructions related to the bead here.
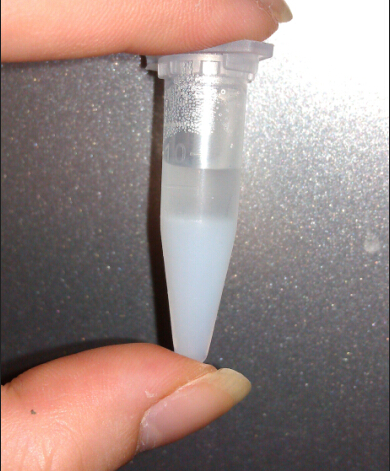
Agarose Beads in tube
To avoid contamination, we usually aliquot the beads into small tubes. The beads are stored in PBS (Phosphate Buffer Saline) to maintain the activity of GSH on the beads. The density of agarose is much higher than that of PBS, so the mixture will automatically separate into two parts when keeping still for about five minutes. Don’t forget to mix them again before using.
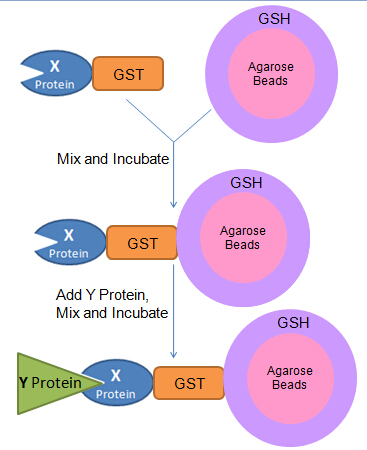
Schematic of GST-based pull down assay
How does the assay work? GST has very high specific affinity to GSH, so the bait can be captured by the beads. When the prey added, if Y protein has specific interaction with X protein it will be pulled down as a Bead-GST-X-Y complex; if not, there will be no Y protein pulled down. The mixture should be washed every time after incubation to wash away non-specifically bound proteins. We will use SDS-PAGE and Western blotting to detect whether Y protein is pulled down.
Data are meaningless without a proper control. When the concentration of the prey is too high, non-specific binding will still exist even after several times of washing and elution; the Y protein can even be pulled down by GST protein! We use GST as the negative control of GST-X. If Western blotting shows that Y protein is only detected when using GST-X, it can serve as a proof of interactions between X and Y protein.