It is exciting to obtain strains with high enzyme activity, but do cellulases truly locate on the surface of our Pichia pastoris? We need further experiments for verification.
Step 11. Immunofluorescence assay
As described in my previous post (Surface co-display of cellulases with synergy in Pichia pastoris (Part II)), our cellulases are expressed with a tag (Table 1), which can bind specifically to their primary and secondary antibodies, thus be detected by immunofluorescence assay.
Protocol:
Take 2mL enzyme solution and collect cells by centrifugation at 4℃, 12000rpm for 1 minute. Wash cells twice with ice cold PBS buffer (pH=7.4). Resuspend the cells in 250μL 1mg/mL BSA (dissolved in PBS buffer (pH=7.4)), and add 2μL (approximately 1μg) primary antibody into the mixture. React cells with primary antibody for 2 hours on ice or overnight at 4℃. After reaction, centrifuge and remove the liquid, then wash cells twice with ice cold PBS buffer (pH=7.4). Resuspend the cells in 250μL 1mg/mL BSA (dissolved in PBS buffer (pH=7.4)), and add 2μL (approximately 1μg) secondary antibody into the mixture. React cells with secondary antibody in dark place for 2 hours on ice (remember to mix the reaction mixture every 20 minutes). After reaction, centrifuge and remove the liquid, then wash cells twice with ice cold PBS buffer (pH=7.4). By now, secondary antibody has bound to our cellulase in ideal condition. To view cells under fluorescence microscope, resuspend cells in 500μL ice cold PBS buffer (pH=7.4), add 5μL resuspended cells to a clean and dry slide, affix a piece of coverslip to the slide and allow the coverslip to dry in the dark before viewing.
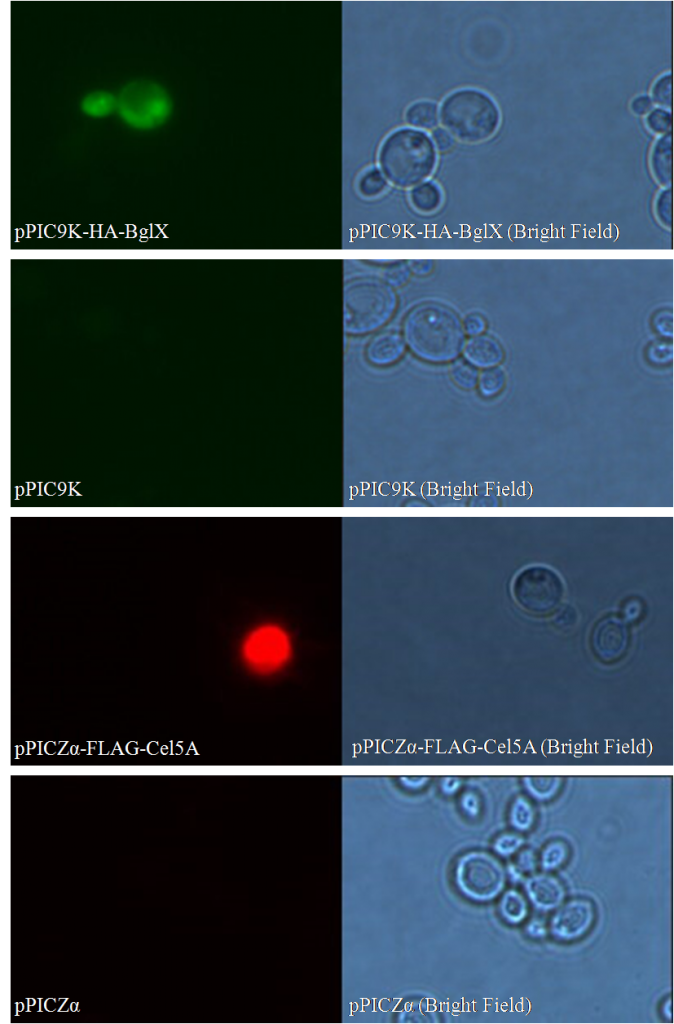
Data are meaningless without a proper control. When the concentration of the antibody is too high, non-specific binding can still exist even after several times of washing; the secondary antibody can even bind directly to cells with no cellulases on their surfaces! Pichia pastoris strains carrying the backbone of vectors (pPIC9K or pPICZα) are used as negative control; their treating processes are exactly the same as our samples.
Besides negative controls, we also need pictures in bright field for both samples and controls; they are used to confirm that 1) what you are viewing is truly cells; 2) the only reason you see nothing in control groups is that no secondary antibody binds to the cells.
As shown in bright field, in both sample groups (Figure 1- pPIC9K-HA-BglX and Figure 1-pPICZα-FLAG-Cel5A ) and control groups (Figure 1-pPIC9K and Figure 1-pPICZα), there are cells on slides. However, fluorescence can only be seen in sample groups, indicating that our cellulases really locate on the surface of Pichia pastoris.
Step 12. Flow cytometry analysis
Besides knowing the location of our cellulases, we also want to know how many of our Pichia pastoris have cellulases displayed on their surfaces. To acquire this knowledge, we need flow cytometry analysis.
Flow cytometry is a fast and high throughput method that can scan single cells flowing past excitation sources in a liquid medium, and classify cells based on the measurement of fluorescent light emission. In other words, flow cytometry analysis can divide our cells into two groups; one displays cellulases on their surface (with fluorescent light emission), the other does not (without fluorescent light emission).
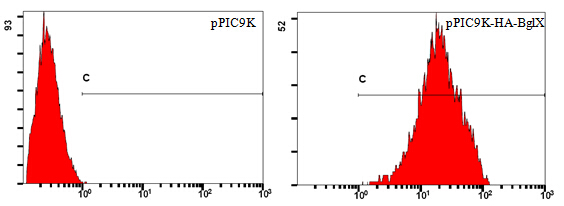
Take pPIC9K-HA-BglX as an example (Figure 2). Cells carrying the backbone of pPIC9K are used as negative control. Numbers on horizontal axis represent relative fluorescent intensity of single cells, which are proportional to the amount of cellulases displayed on single cells. Vertical axis shows relative quantity of cells.
Lines in both pictures are identical; its left end corresponds to the highest fluorescent intensity of single cells in the control group. Single cells in the sample group, which have higher fluorescent intensity than the highest fluorescent intensity in the control group, are considered truly displaying cellulases on their surfaces. The percentage of cells display cellulases on their surfaces can be read directly using professional software, like FlowJo.


