Step 8. Genomic PCR analysis
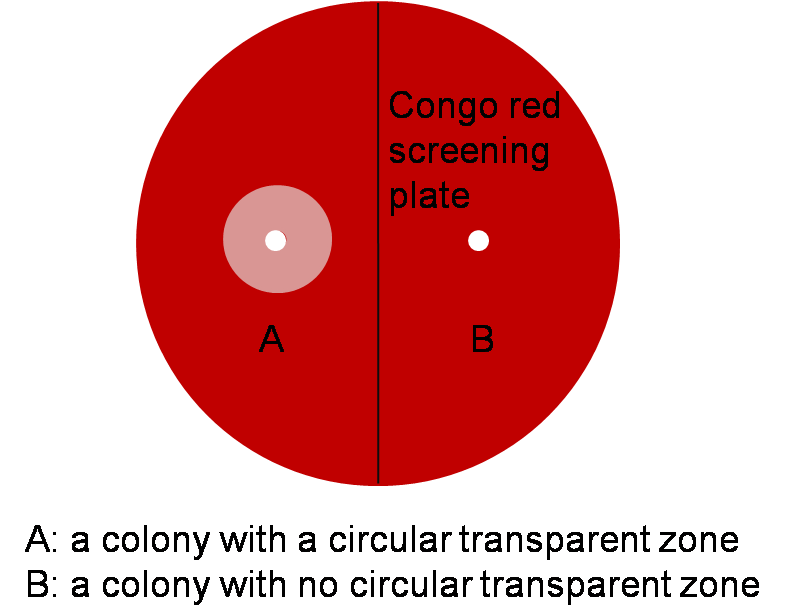
Although the reason why the transparent zone method turns out invalid in our project is not fully understood, the project proceeds with other method. Genomic PCR (Polymerase chain reaction) analysis is used for further screening.
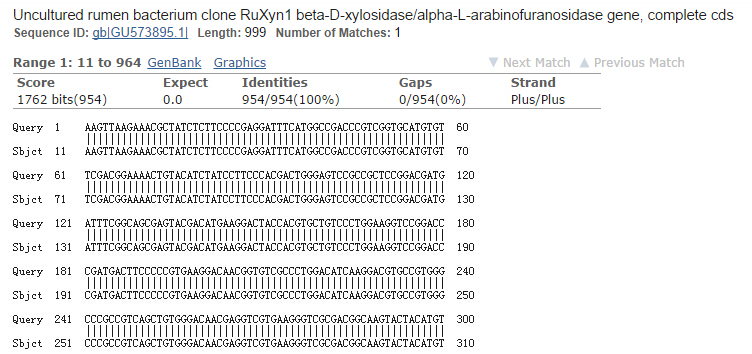
Genomic PCR is PCR using genome as template. This method is used to verify two things: 1) the cellulase gene is truly integrated into the genome of the transformants; 2) the cellulase gene integrated into the genome of our transformants has correct sequence. Genome DNA isolation and genomic PCR are carried out according to standard protocol from Molecular Cloning: A Laboratory Manual (Sambrook J, et al. 2001).
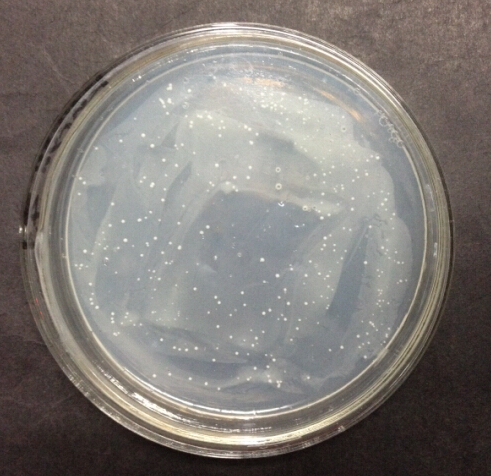
Isolated genome DNA is firstly identified by agarose gel electrophoresis (Figure 1), and secondly used as template in subsequent genomic PCR reaction.
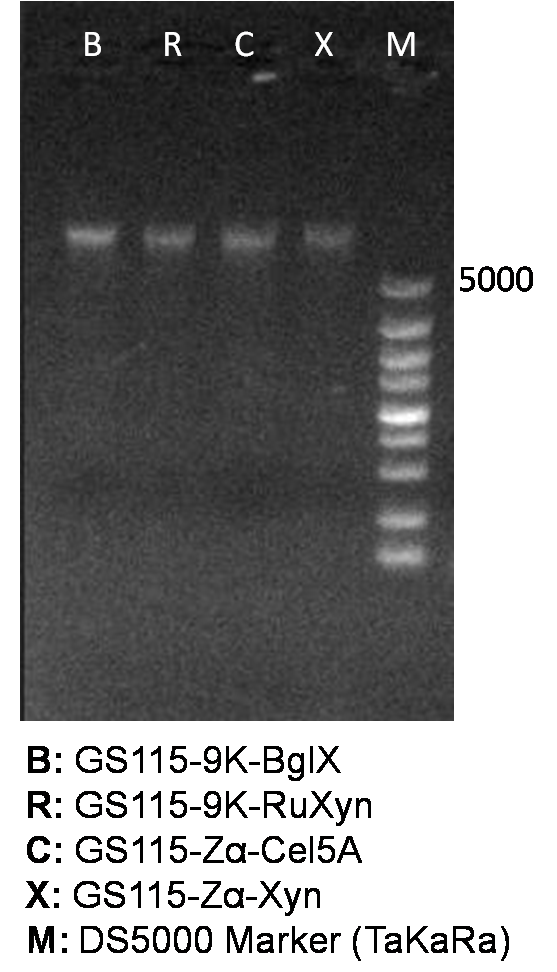
Figure 1. Identification of genome DNA
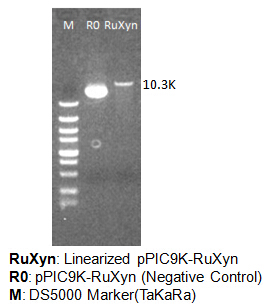
The primers we used in genomic PCR reaction system are specific to the cellulase gene (Table 1). If the cellulase gene is truly integrated into the genome of the transformants, the PCR product should be the same size of the corresponding cellulase gene. The size of the PCR product is identified by agarose gel electrophoresis (Figure 2). In negative control, sterile water is used to replace template in the PCR reaction system to avoid the disturbance of primer dimers.
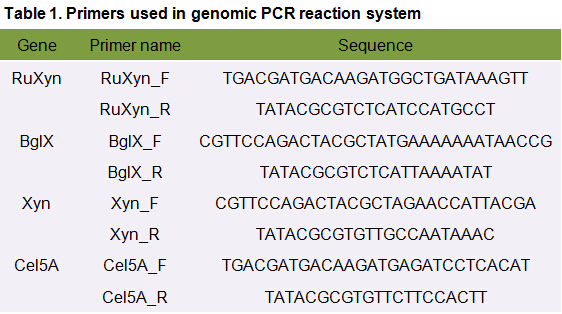
Table 1. Primers used in genomic PCR reaction system
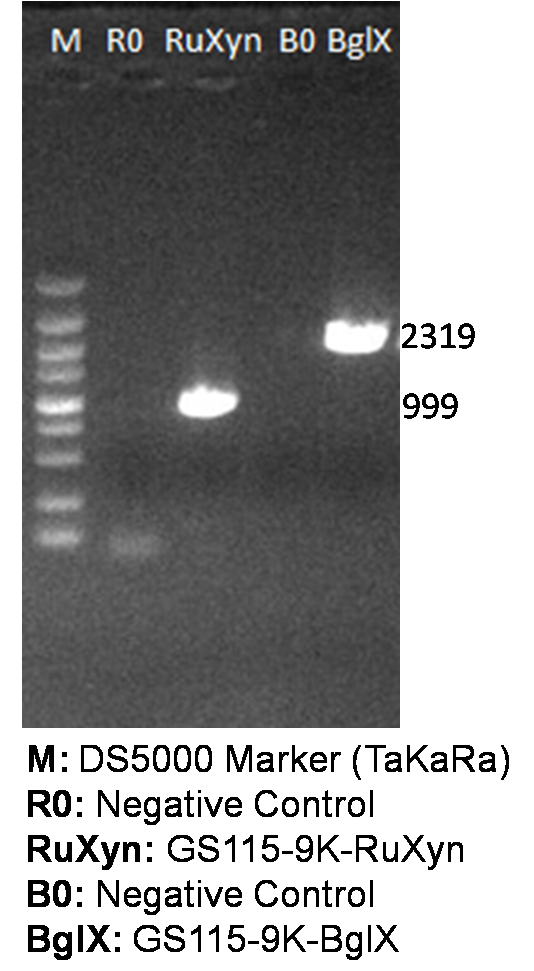
Figure 2. Identification of genome PCR product
Transformant with positive genomic PCR result is called recombinant (an organism carrying foreign DNA in its genome via genetic recombination). PCR products of recombinants are sent for sequencing. According to the sequencing result, recombinants carry the correct cellulase gene are used for fermentation.
Step 9. Continuous Fermentation
After resistance selection and genomic PCR analysis, recombinants selected are inoculated into 20mL flasks with 5mL YPD medium, and cultivated at 28℃ 200r/min over night for activation. 1mL bacteria culture is then inoculated into 500mL flasks with 50mL BMMY induction medium for fermentation. The cells are induced for 120h at 28℃ 200r/min. 500uL methanol (1%) is added to the medium every 24h to maintain induction. Aseptic techniques are required in the entire process of fermentation.