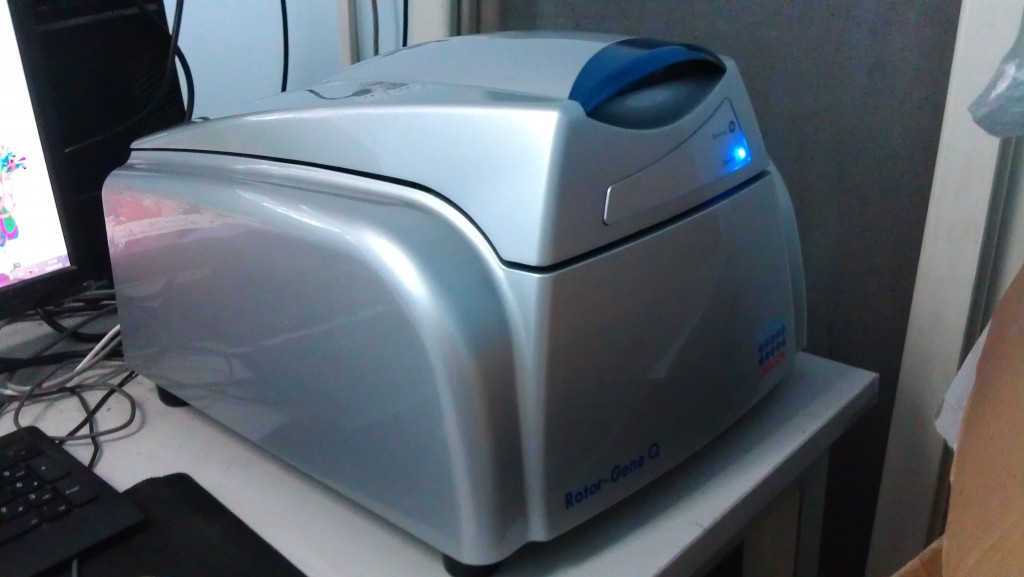
These days, I’ve been using HRM to scan mutations in target gene of patients with Ventricular Tachycardia (VT).
Double-stranded DNA (dsDNA) will dissociate at a certain high temperature; the temperature depends on the sequence and the structure of the dsDNA. The melting curve is an important property of dsDNA. dsDNAs with only one different base pair will have different melting curve, thus we can use it to detect mutant genes.
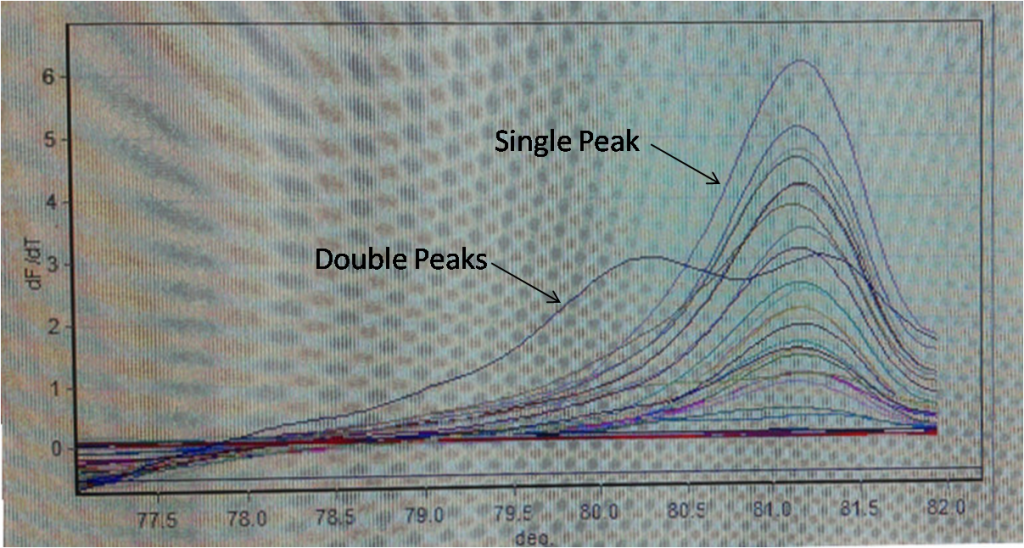
Human chromosomes are diplont. Since mutations are rare, even if the target gene of the patient is mutated, it is most likely to be heterozygous mutation (it is possible to be homozygous mutation, but very rare) and usually single base mutation. When use heterozygous mutated gene as PCR template, the product will have two different melting temperatures. In the Rotor-Gene Q Software (software that we use to process data of HRM in our lab) normal samples have a single peak at the melting temperature, while mutant samples have two. We can further sequence samples with two peaks to detect the mutated base pair.
This method is enabled by adding dsDNA-binding dyes (eg. SYTO® 9 Green Fluorescent Nucleic Acid Stain) when conducting PCR. The Rotor-Gene Q can draw the melting curve by detecting the fluorescence of the sample.
Example:
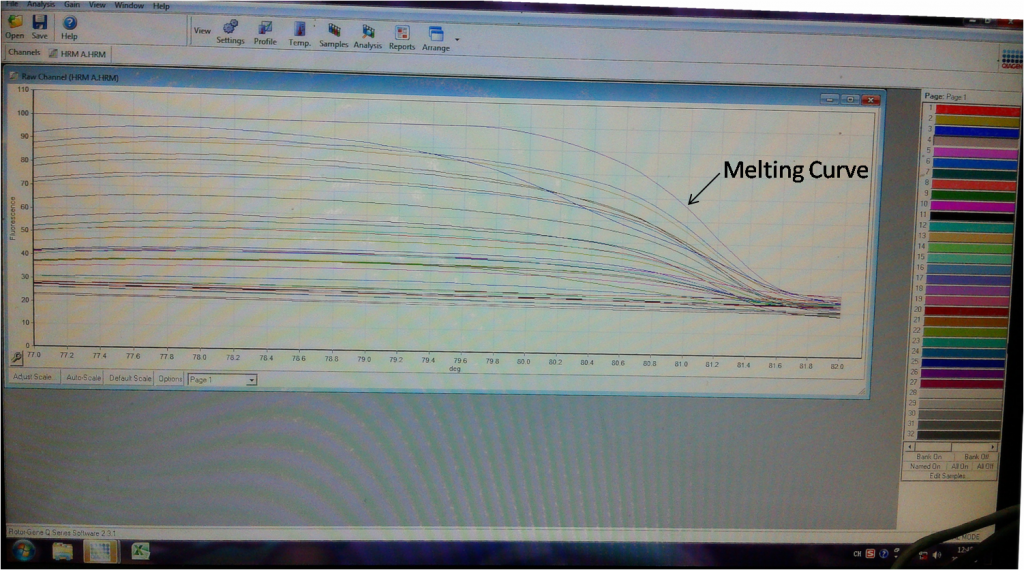
The result of one test shows the melting curves of 36 samples. The horizontal axis shows the temperature range, the vertical axis represents fluorescence intensity. The fluorescence intensity goes down sharply at a certain temperature, namely melting temperature.
Use the software to process the raw data. The horizontal axis shows the temperature range, the vertical axis represents dF/dT. The melt data shows that all samples have a single peak while one sample has two peaks, which indicates the possible mutation.


